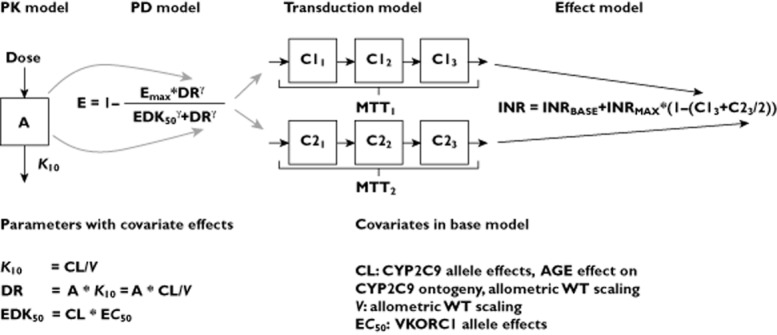
Figure 1.

Schematic picture of the bridged warfarin model [21] used as base model in this study and a list of covariate effects included in the base model. The model consists of a one compartment PK model that describes the relationship between warfarin dose and S-warfarin concentrations (PK), and an inhibitory Emax-model to describe inhibition of the vitamin K cycle (PD), with S-warfarin as the only predictor of the anticoagulant response. Included also is a transduction model that captures the time delay between the inhibition of the vitamin K cycle, and the decrease in functioning coagulation factors (II, VII, IX and X), and finally an effect model that translates the decrease in functioning coagulation factors to an increase in INR. Compartment A represents amount of warfarin in the body, K10 the rate constant governing drug elimination from the body but also distribution to the site of action, here denoted DR for dose rate. EDK50, is the dose rate that results in 50% of the maximum effect Emax and MTT is the mean transit time through the transduction-model
