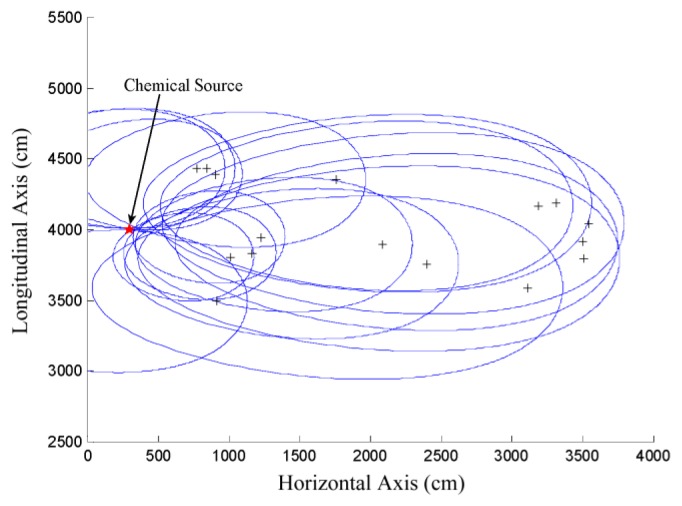
Figure 5.
The positional relationship between the actual chemical source location and the points in different refined sample spaces, i.e., Si, i ∈ [1,l], which are represented by different ovals. The sensor nodes are denoted as crosses. The simulation setup used to generate this figure is the same as that used in generating Figure 2, which will be detailed in Section 4.

