Figure 8.


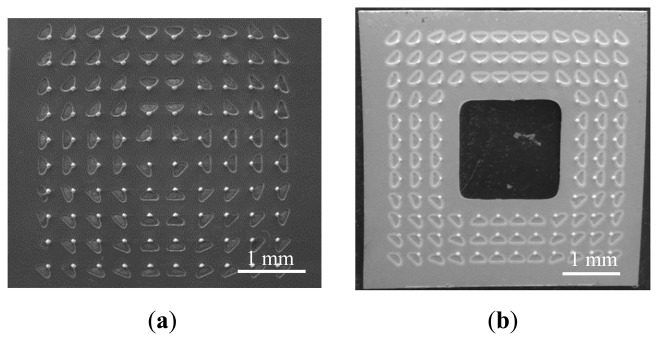
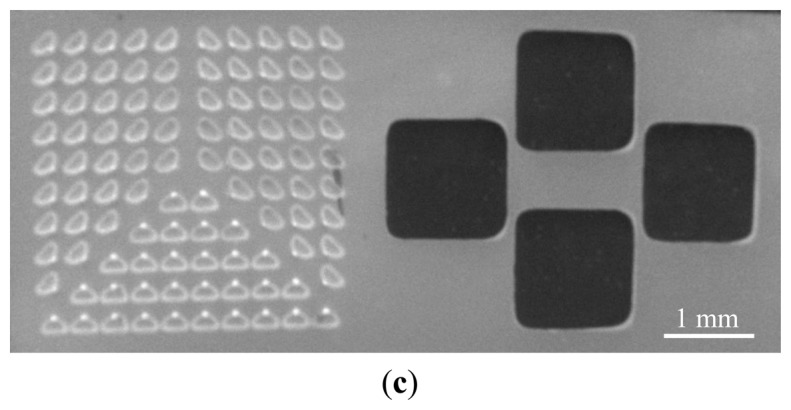
Tip array SEM images: (a) without TSV; (b) with TSV at the array center; and (c) with TSV beside the array. The scale bar is 1 mm.


Tip array SEM images: (a) without TSV; (b) with TSV at the array center; and (c) with TSV beside the array. The scale bar is 1 mm.