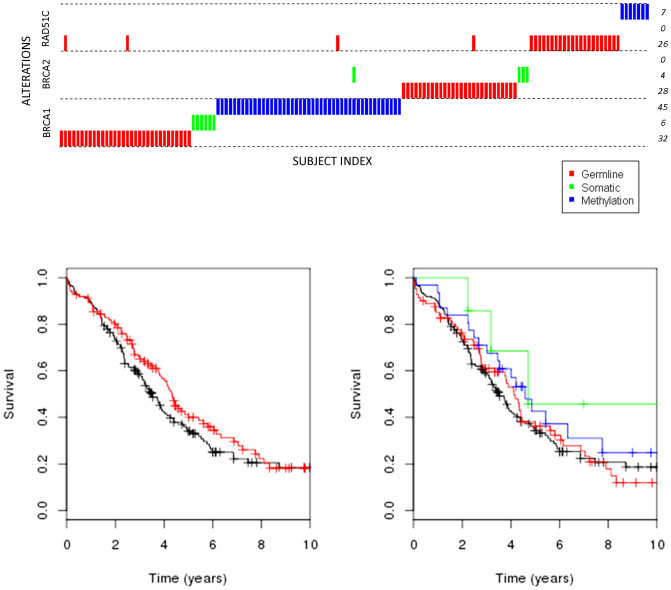
Figure 2. Overall survival for high grade serous EOC by HRD and type of alteration.
(A). Red: HRD; Black: NAD. (B). Above is a depiction of samples with type of alteration in each gene; below are the Kaplan Meier curves. Red: germline deleterious mutation; Green: somatic deleterious mutation; Blue: somatic methylation; Black: no germline mutation, somatic mutation or methylation.

