Figure 1.
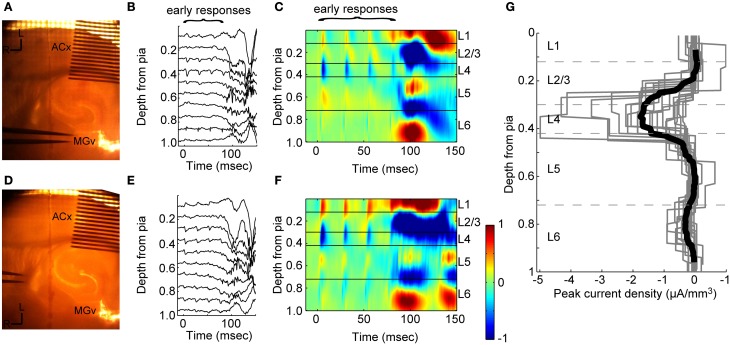
Extracellular responses to stimulation of thalamic afferents. (A) Experiment setup for CSD recordings. A 16-shank electrode is inserted into auditory cortex (100 μm between shanks) and a bipolar stimulating electrode is located in MGv. (B) Example filtered (1–300 Hz) LFP from one trial in response to four stimulus pulses at 40 Hz. Stimulus onset at t = 0. (C) CSD for this experiment calculated from an average of 20 trials as in (B) shows the laminar pattern of current sinks (blue and cold colors) and sources (red and hot colors) elicited by stimulation in MGv. Early current sinks are located in layer 4 and deep layer 3 (“early responses”). These early sinks are followed by large current sinks in both infragranular and granular layers which we refer to as UP states (see Figure 2). The vertical depth axis is normalized to the distance from the pia to white matter, typically around 1 mm for mouse auditory cortex. Color scale is ±1 μA/mm3. (D–F) Same experiment as in (A–C), but with stimulating electrodes placed in the superior thalamic radiation containing thalamo-cortical fibers instead of directly in MGv, as was common in experiments on older animals. Early and late responses were nearly identical between TC fiber stimulation and stimulation in MGv. (G) Peak negative current density in the window 3 < t < 20 ms after the first thalamic stimulus pulse for individual experiments (gray lines) shows the initial monosynaptic component is located in layer 4 and deep in layer 3 (dark black line: mean across experiments). Dashed lines indicate layer boundaries.

