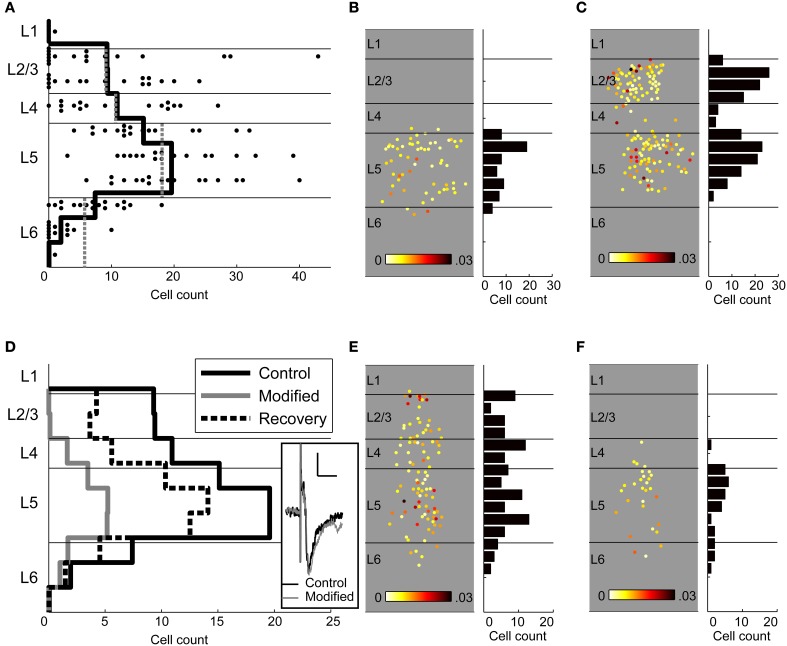
Figure 10.
Laminar profile of spiking responses. (A) The number of responding cells detected using calcium imaging is plotted in 100 μm bins (dots) as well as the average number of cells per experiment (solid black line). In many experiments, there were few if any responding cells in layers 2/3, while every experiment showed robust activity in layer 5. The laminar distribution of cells observed spiking using calcium imaging in control conditions is nearly identical to the expected distribution based on on-cell recordings (gray dotted lines). (B) An example experiment in which thalamocortical stimulation primarily activated cells in layer 5, with no activity in layer 2/3. (C) In the same experiment, stimulation of a nearby cortical area triggered robust spiking in the imaged column, including in layers 2/3, demonstrating that the lack of layer 2/3 responses in (B) was not due to poor labeling or health of the superficial layers. (D) Cell counts in control conditions [solid black lines; same data as in (A)] show that layer 5 had a significantly greater density of spiking cells than the other layers. Modified ACSF (solid gray lines; modified ACSF contains elevated concentrations of divalent cations or 40 μ M APV) strongly reduced spiking across the cortical laminae, and layer 2/3 was more affected than the other layers. Modified ACSF eliminated UP state activity but did not affect the early component of the field potential response (inset; scale bar 10 ms, 0.2 mV). Recovery after high divalent cations (thick dashed lines) was similar to control cell counts. (E) An example experiment in which spiking cells were seen in all layers in normal ACSF. (F) The same experiment from (E) but with modified, high-divalent ACSF that blocks UP states. Far fewer cells are activated without UP states, and activity in layer 2/3 is completely blocked. Conventions for panels (B,C,E,F) are the same as the similar panels in Figures 7, 9.

