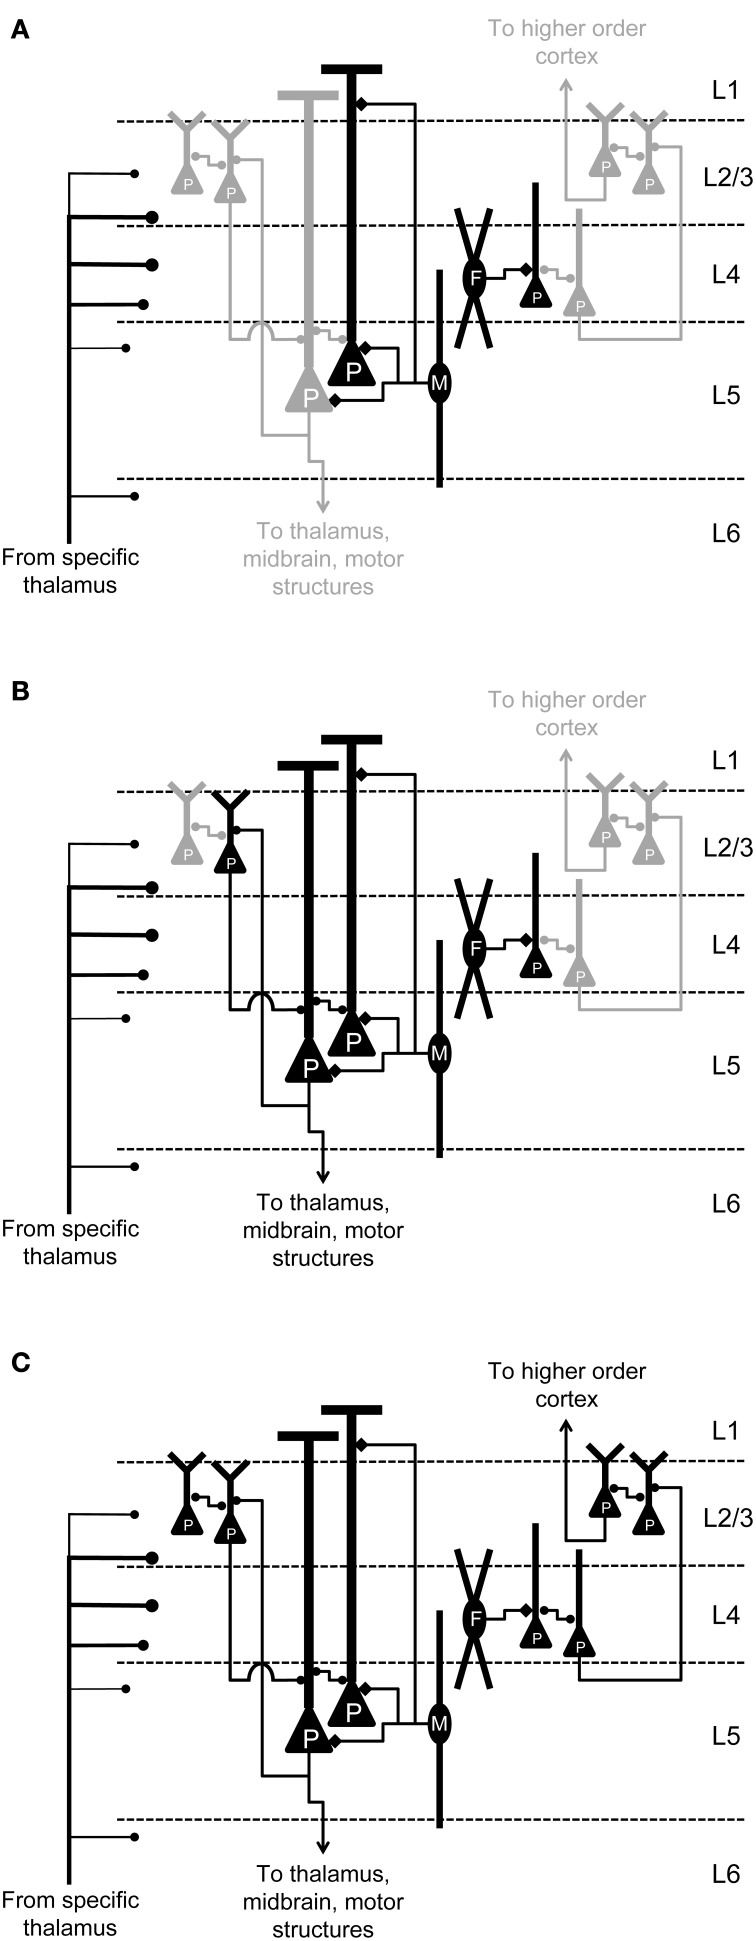
Figure 13.
Diversity of activity patterns in response to thalamic stimulation. Circuit diagrams of auditory cortex summarizing key findings from this study and previous reports. Pyramidal cells (triangles) and GABAergic interneurons (ovals; M, Martinotti cells; F, fast-spiking cells) are depicted along with some of their local connections. Active cells are in black, inactive cells are in gray. (A) Thalamic stimulation elicits monosynaptic responses primarily in GABAergic cells and a small number of pyramidal cells in layers 4 and 5. (B) For stimuli of sufficient intensity and after a delay of ~10–100 ms, UP state activity emerges in the infragranular network. (C) Strong stimuli trigger UP state activity that spreads to supragranular layers as well.

