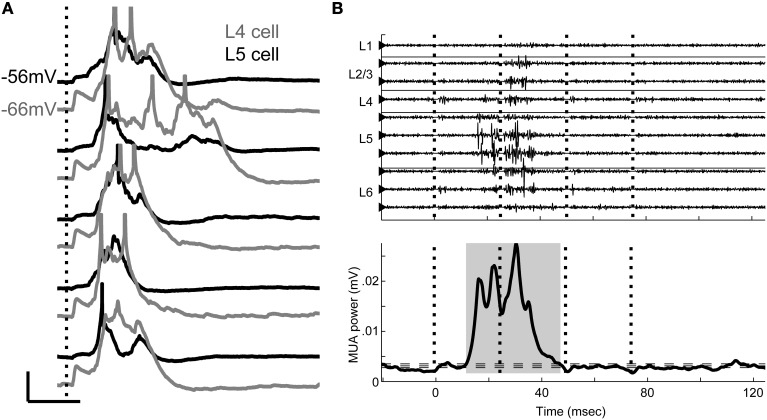
Figure 2.
Evoked UP states. (A) Simultaneous whole-cell recordings from a layer 4 cell (gray) and a layer 5 cell (black) on five consecutive trials in response to single stimulation pulse applied to TC afferents (vertical dotted line) show that UP states are network events with variable duration between trials but consistent time course between cells on a given trial. Scale bar: 50 ms, 10 mV. Action potentials are truncated. (B) Multiunit activity (filtered 0.3–3 kHz) from multichannel recordings similar to Figure 1 shows the UP state as a burst of high frequency activity occurring on multiple channels, but beginning in layer 5 (top). Vertical dotted lines mark stimulus times. The smoothed MUA power in layer 5 is used to detect UP states (shaded gray area, bottom) on single trials. Horizontal dashed lines represent the boundaries used to detect UP state onset and offset (see Materials and Methods).

