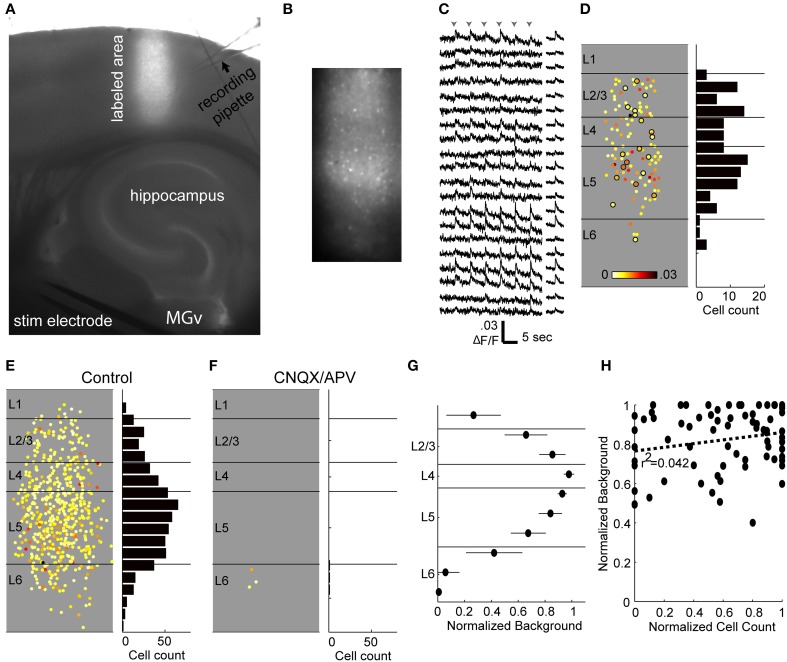
Figure 7.
Calcium imaging technique. (A) Low-power combination fluorescence and brightfield micrograph shows OGB-1 dye loaded into a vertical strip of auditory cortex. (B) 10X response image taken by subtracting baseline fluorescence averaged over 1 s from 1 s of response to TC stimulation. Single responding cells are clearly seen as bright spots. (C) Sample fluorescence traces from a random selection of cells identified in the labeled region in (B) and sorted by depth (top, superficial; bottom, deep). Traces on the left are from single movies during which six stimuli (arrowheads) were presented 5 s apart and smoothed over 5 frames. Traces on the right are averages across stimulus presentations. Note that here and throughout, the units for fluorescence traces are ΔF/F, not %ΔF/F. (D) Left, all responsive cells from the example experiment, plotted according to their location in the column and average change in fluorescence. Circled cells correspond to those with traces plotted in (C). Right, spatial histogram of responding cell counts in 50 μm bins. (E) Cells responding to thalamocortical input in eight separate experiments, plotted on top of each other in normalized depth coordinates. (F) Responses from the same eight experiments in the presence of CNQX/APV. Almost all of the responding cells from (E) are blocked. (G) The background fluorescence signal was averaged within 100 μm depth bins and normalized to the brightest bin as a measure of labeling intensity. Points are plotted as mean ± standard deviation. (H) Normalized background as in (G) vs. cell count as in (D) (normalized within experiments to the layer containing the most spikes) for layers 2–5. Each point represents the background and cell count in a single 100 μm bin from a single experiment.

