Figure 9.
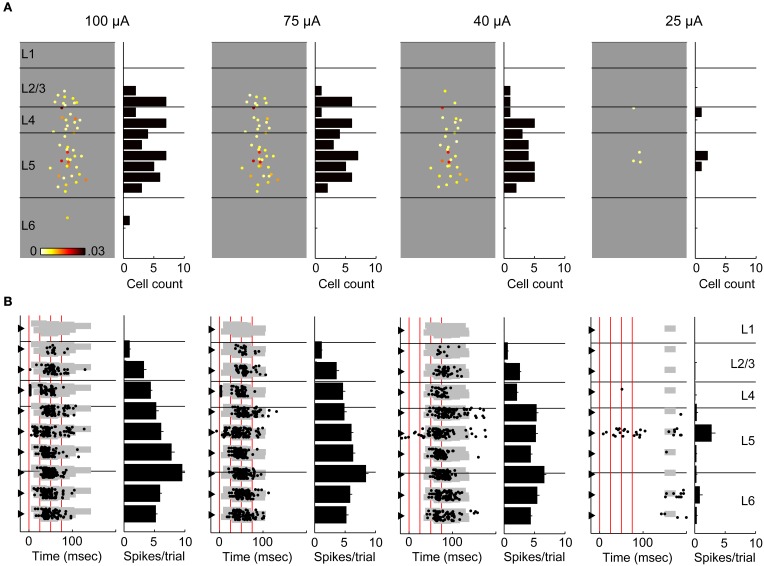
Comparing calcium imaging with simultaneous multichannel recordings. (A) An example experiment at four different stimulus intensities (100–25 μ A). At each intensity, responsive cells are plotted at their spatial position (left), color-coded to response amplitude. Color scale is 0–0.03 ΔF/F. Lines represent layer boundaries. To the right of each example experiment is a histogram count of the cells in 50 μm depth bins. (B) Simultaneous multichannel, multiunit recordings from the experiment in (A). At each intensity, a spike raster (left) from 12 trials is plotted at the depth coordinate of each channel. The gray shaded area indicates detected UP states similar to Figure 5. Accompanying each raster plot is a depth histogram (right) showing the average number of spikes per trial on each channel. Error bars are s.e.m. Stimulus times are marked by vertical red lines. Note that early spiking activity on the electrode in layer 4 (visible immediately adjacent to the red line indicating stimulus time) is not present at lower stimulus intensities despite robust spiking associated with an evoked UP state. Also, for both techniques, spiking was very sparse at the lowest stimulus intensity (which did not reliably trigger UP states) and these sparse spikes included activity in layer 5.

