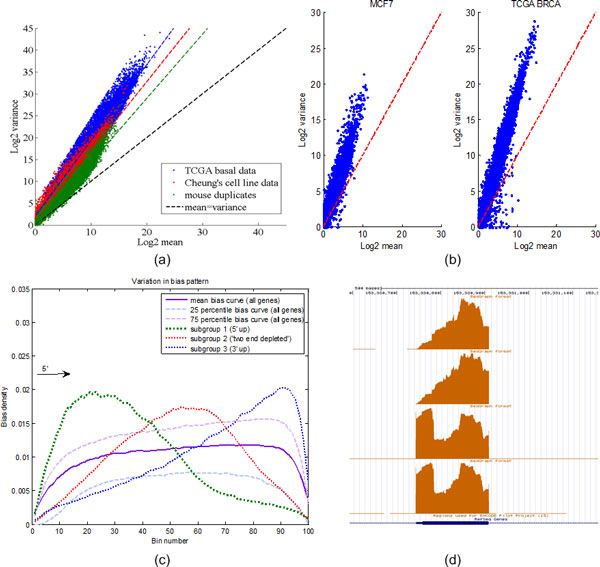
Figure 2.

Between-sample variation and within-sample variation in RNA-Seq data.(a) Three datasets are used to show the over-dispersion of reads across samples. Scatter plots are in log 2 scale. (b) In both MCF7 breast cancer samples and TCGA breast cancer patient samples, we observe that the variance of read counts is significantly larger than the average counts in 100nt bins. (c) Bias patterns of genes in the same sample are further dissected. In contrast to a general right-tailed (biased towards 3'-end of transcript) coverage, we also observe groups of genes that have either biased expression towards the 5'-end, or depleted expression in both ends. (d) An example to show variation of sequencing bias among biological samples.
