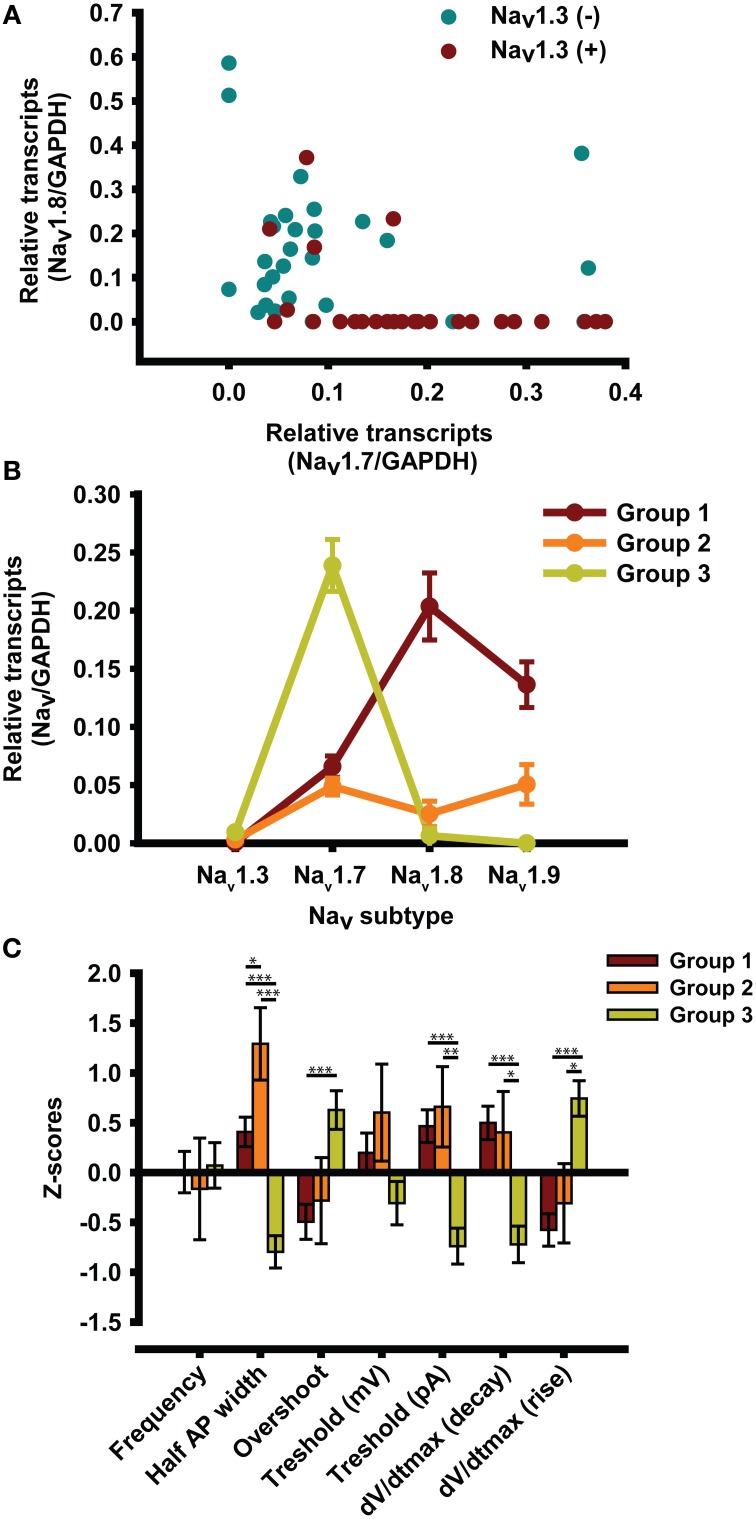
Figure 3.
Cluster analysis. (A) Graphical representation of the distribution of Nav mRNA as a function of the presence of Nav1.3 mRNA. (B) Cluster analyses of mRNA from single DRG neurons revealed three profiles that represent 49, 8, and 43% of all the small diameter DRG neurons tested (<30 μm). (C) Electrophysiological characterization of the three profiles expressed as z-scores ± s.e.m. Neurons are recorded without TTX. z-scores = (x-mean)/SD; *p < 0.05; **p < 0.01; ***p < 0.001, n = 49 from 16 animals.

