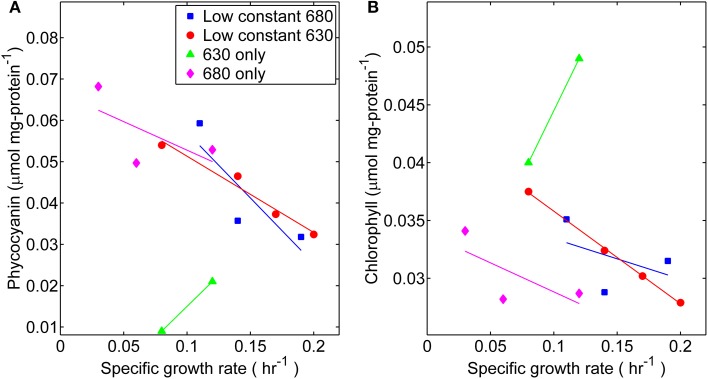
Figure 5.
Comparisons of (A) phycocyanin content and (B) chlorophyll content (μmol per mg protein) at different specific growth rates. Samples were harvested directly from the turbidostat during steady-state growth corresponding to each light regime: (■) 53 μmol photons m−2 · s−1 of 680 nm light plus variable amounts of 630 nm light, (●) 50 μmol photons m−2 · s−1 of 630 nm light plus variable amounts of 680 nm light, (▲) 630 nm light only, or (♦) 680 nm light only.

