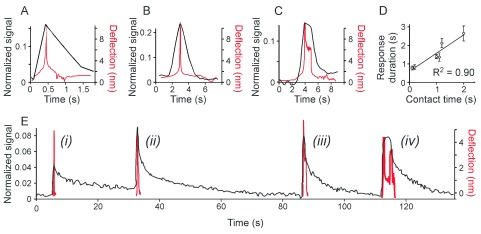
Figure 4. The duration of the low level deformation determines the duration of the Ca 2+ elevation.

C2C12-derived osteoblasts were loaded with fluo4-AM and responses to single indentation were assessed. The maximum force was set below the membrane rupture force. A–C) Examples of Ca 2+ transients in black (left scale) in response to indentation performed with different contact time. Overlaid are the cantilever deflection curves in red (right scale). The indentation speed was set to 20 mm/s ( A) or 2 mm/s ( B, C). For C, the probe was maintained in contact with the cell for additional 1 s. D) The Ca 2+ transient duration is plotted as a function of contact time. Data are means ± SE, for 0.1 s and 1.2 s n = 4, for 0.2 s n = 2, for 1.0, 1.1 and 2.0 s n = 3. Linear fit is f(x) = 0.98x + 0.60 with R 2=0.90. E) A single cell exhibited [Ca 2+] i elevations of different duration in response to indentations with different contact times. The indentation speed was 20 µm/s, the probe was maintained in contact with the cell for additional i) 0 s, ii) 0.3 s, iii) 0.7 s and iv) 3 s.
