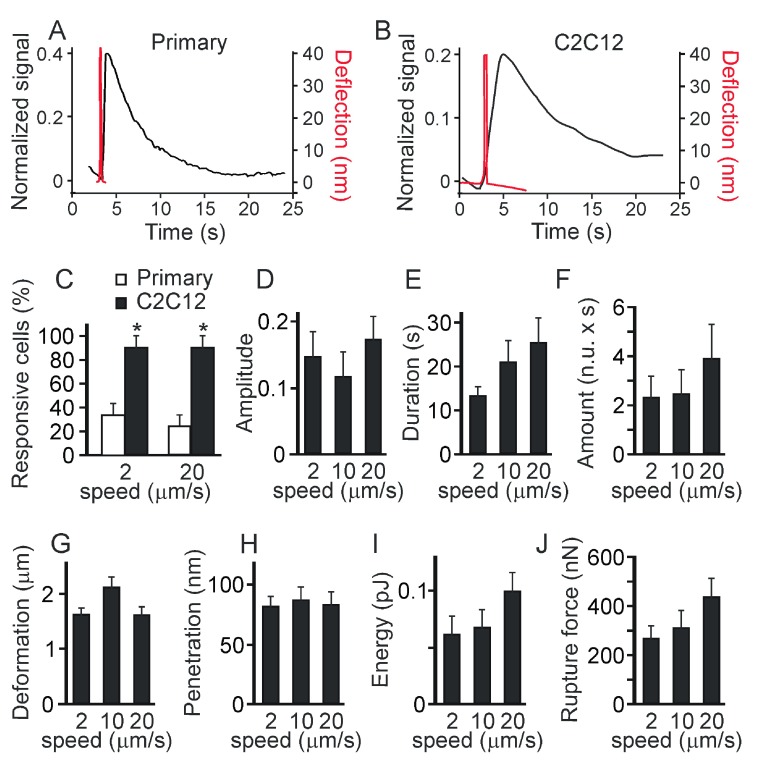
Figure 6. The Ca 2+ responses to indentation resulting in penetration are not significantly affected by the speed of the indentation or the contact time.
Primary mouse osteoblasts or osteoblasts generated from C2C12 cells were loaded with fluo4-AM and single indentations were performed. The maximum force was set above the membrane rupture force. A, B) Examples of Ca 2+ transients (left scale) in primary osteoblast ( A) or C2C12-derived osteoclast ( B) in response to the high-load indentations. Overlaid are the cantilever deflection curves in red ( right scale). C) The percentage of cells that exhibit global Ca 2+ elevations in primary (white) or C2C12-generated (black) osteoblasts in response to the high-load indentations performed with different speed of 2 or 20 μm/s. Data are means ± SE, n = 25 for primary osteoblasts and n=10 for C2C12-derived osteoblasts, # indicates a p<0.05 difference between primary and C2C12-generated osteoblasts as assessed by Fisher Exact Probability test. D–F) Changes in global Ca 2+ in response to membrane penetration in C2C12-derived osteoblasts were analyzed for the amplitude of Ca 2+ response ( D), the duration of Ca 2+ response ( E) and the amount of Ca 2+ released during the response ( F). Data are means ± SE, n is the number of response from 10 trials: for 2 µm/s n = 9, for 10 µm/s n = 10, and for 20 µm/s n = 9, no significant difference. G– J) Force-distance curves were analyzed for the extent of membrane deformation ( G), penetration depth ( H), energy spent to deform and penetrate the membrane ( I) and membrane rupture force ( J). Data are means ± SE, n = 10, no significant difference.

