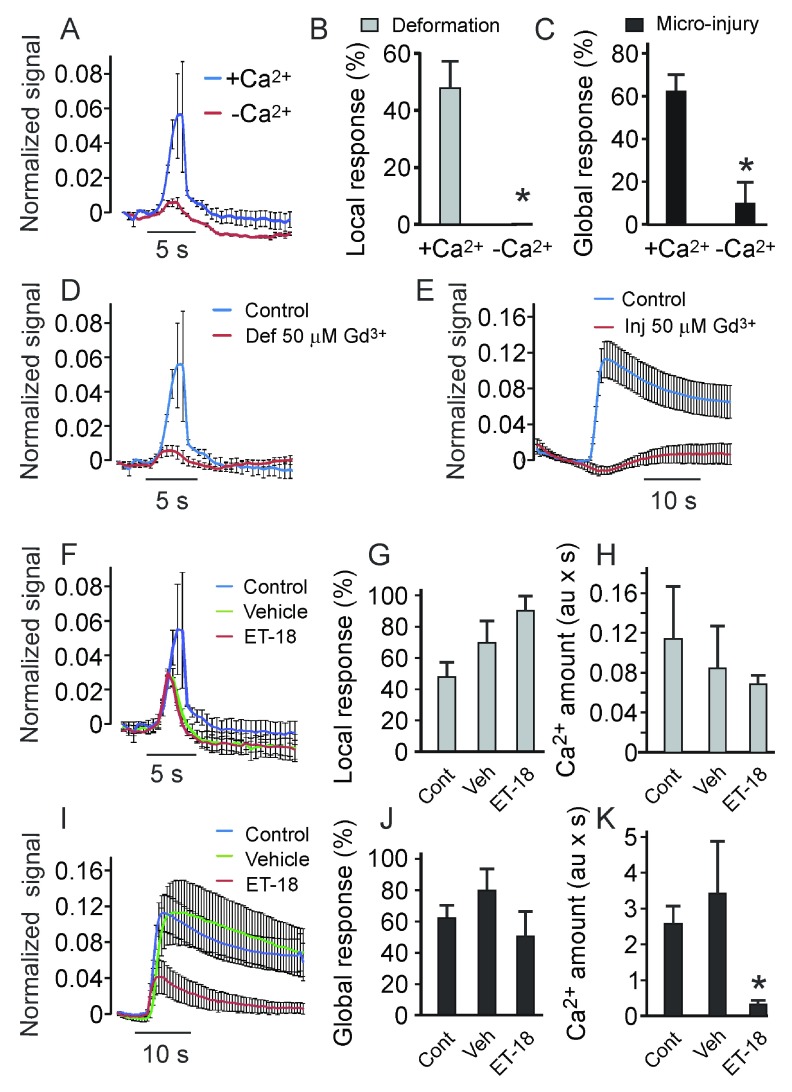
Figure 7. The membrane deformation-induced Ca 2+ responses are affected by inhibitors of stretch-activated Ca 2+ channels and phospholipase C.
C2C12-generated osteoblasts were loaded with fluo4-AM, and single indentations were performed at 2 μm/s. A) Average local Ca 2+ transients in response to low-load indentation in Ca 2+-containing (blue) and Ca 2+-free (10 mM EGTA, red) buffer. Data are means ± SE. B, C) Percentage of cells exhibiting local ( B) and global ( C) Ca 2+ elevations in Ca 2+-containing (+Ca 2+) or Ca 2+ free (-Ca 2+) buffer in response to low-load ( B) or high-load ( C) indentation. Data are means ± SE, for ( B) n = 30 for Ca 2+-containing, n = 10 for Ca 2+-free; for ( C) n = 10; *indicates a p<0.05 difference as assessed by Fisher Exact Probability test. D) Average local Ca 2+ transients in response to membrane indentation in control (blue) or mechanosensitive Ca 2+ channel blocker Gd 3+ (50 µM)-containing buffer (red). Data are means ± SE. E) Average global Ca 2+ transients in response to membrane penetration in control (blue) or Gd 3+-containing buffer (red). Data are means ± SE. F) Average local Ca 2+ responses to membrane indentation in control (blue), vehicle (0.07% ethanol)-containing (green) or PLC inhibitor Et-18-OCH 3-containing (red) buffer. Data are means ± SE. G) The percentage of cells that exhibited local Ca 2+ elevations in response to membrane indentation in control, vehicle- or Et-18-OCH 3-containing buffer. Data are means ± SE, n = 30 for control, n = 10 for vehicle and Et-18-OCH 3-treated cells, no significant difference. H) Average amount of Ca 2+ released in response to membrane indentation in control, vehicle- or Et-18-OCH 3-containing buffer. Data are means ± SE, n = 4–5, no significant difference. I) Average global Ca 2+ elevations in response to membrane penetration in control (blue), vehicle-containing (green) or Et-18-OCH 3-containing (red) buffer. Data are means ± SE. J) The percentage of cells that exhibited global Ca 2+ elevations in response to membrane penetration. Data are means ± SE, n = 33 for control, n = 10 for vehicle and Et-18-OCH 3-treated cells, no significant difference. K) Average amount of Ca 2+ released in response to membrane penetration. Data are means ± SE, n = 8 for control and vehicle, n = 5 for Et-18-OCH 3-treated cells, *indicates a p<0.05 difference as assessed by Student’s t-test.

