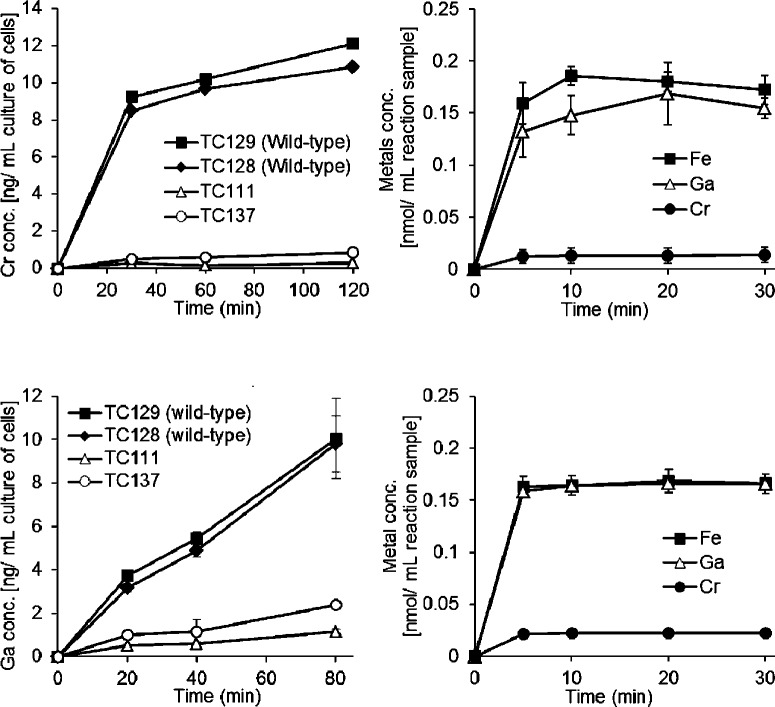
Figure 3.
(A and B) Imported Cr amounts (panel A) and Ga amounts (panel B) in cells of TC129 (YxeB-L142, wild-type), TC128 (YxeB-S142, wild-type), TC111 (yxeB–), and TC137 (fhuBG–). 2 μM Cr-DFO or Ga-DFO was added in the culture and the amount of Cr or Ga in the cells was measured by ICP. The optical density (OD) of the cultures at 600 nm after 0 and 120 min incubation with Cr-DFO were 0.9–1.3 and 2.0–2.1, respectively. The OD at 600 nm after 0 and 80 min incubation with Ga-DFO were 0.8–1.1 and 1.6–1.8, respectively. Data are the average of two independent experiments. Bars are the standard errors. (C and D) In vitro substrate binding (exchange or displacement) assays for the DFO:YxeB-L/S142-6×His complex. After the DFO:YxeB-L/S142-6×His complex had been created, 0.2 μM FO, Ga-DFO or Cr-DFO was added in the samples. The protein complex was collected as described in the Methods and the amount of Fe, Ga or Cr in the complex was then measured by ICP. Fe amount, closed squares; Ga amount, open triangles; Cr amount, closed circles. Data are the average of three independent experiments. Bars indicate the standard errors. The amount of Fe, Ga, or Cr in the complex after 30 min incubation is shown in Table 2.

