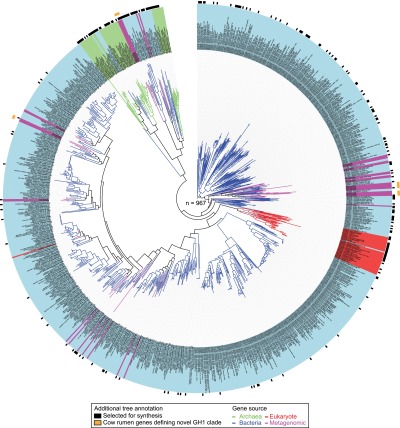
Figure 1.

Phylogenetic tree of GH1 enzymes (n = 967) retrieved from sequence databases and metagenomic data. Branch and background color of the leaf labels indicate the phylogenetic origin of each GH1 sequence representative by kingdom (blue = bacteria, light green = archaea, red = eukaryota, purple = metagenome). Black rectangles in first outer circle show the GH1 representatives selected for synthesis on the basis of our criteria for maximizing phylogenetic space covered. Orange rectangles on second outer circle show examples of metagenome-derived representatives that define new clades.
