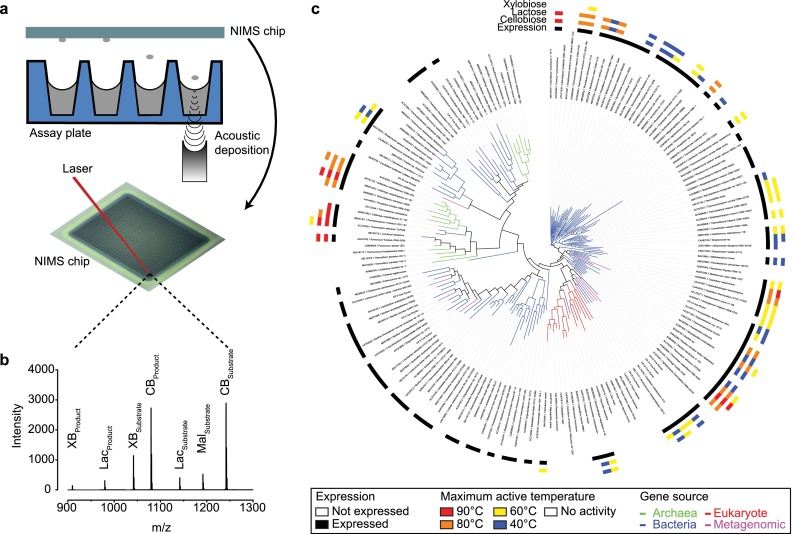
Figure 2.
Overview of acoustic deposition process and NIMS data. (a) Samples are acoustically transferred from the assay plate to the NIMS chip. Individual reactions on the NIMS chip are ionized by a laser and detected by a time-of-flight mass spectrometer. (b) A representative mass spectrum from a single sample derived from the mean of 12 laser shots. The text above the peaks denotes the multiple substrates and products that can be resolved on the basis of mass tags that encode the identity of the substrate (CB = cellobiose, Lac = lactose, XB = xylobiose, Mal = maltose). (c) Enzyme assay results (n = 10,080) for all synthesized GH1 representatives (n = 175) displayed on a phylogenetic tree. Branches are colored according to kingdom. Four concentric outer circles indicate soluble expression and maximum temperature at which enzyme activity was observed for the cellobiose, lactose, and xylobiose NIMS substrates, respectively.

