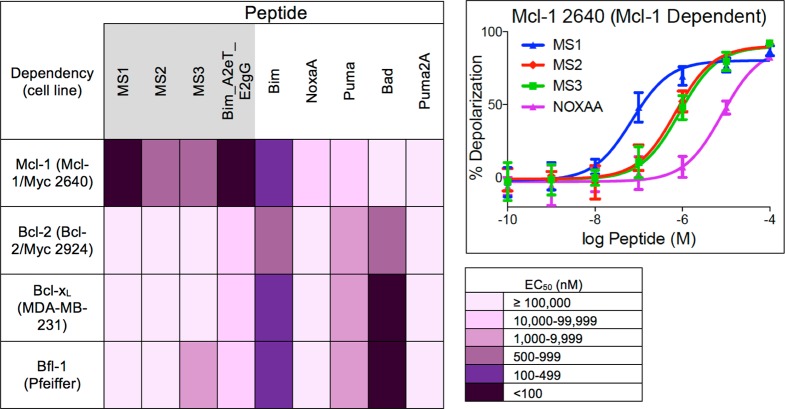
Figure 2.
Heat map of the EC50 values (peptide concentration in nM) for mitochondrial depolarization induced by engineered and native BH3 peptides in four cell lines. Engineered peptide names are shaded in gray. Each cell line is dependent upon a single Bcl-2 family member: Mcl-1, Bcl-2, Bcl-xL, or Bfl-1 as determined by BH3 profiling with native BH3-only peptides (Supplementary Figure 3e–h). All experiments were performed at least three times. The inset shows an example titration curve; see Supplementary Figure 3 and Supplementary Table 3 for other curves and all EC50 values with 95% confidence intervals.

