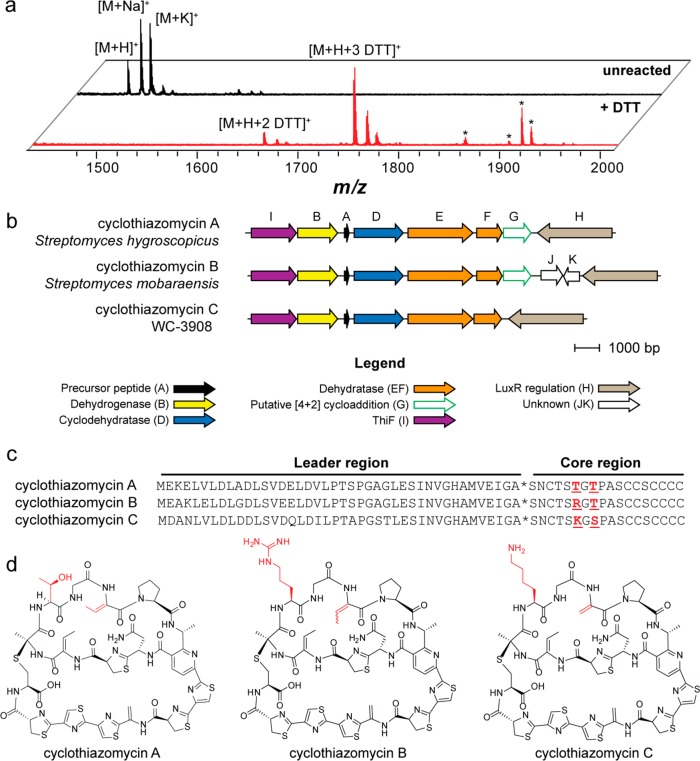
Figure 5.
Identification, genetics, and structure of cyclothiazomycin C. (a) MALDI-TOF MS analysis showing spectra of unreacted (black spectrum, top) and DTT-labeled (red spectrum, bottom) extracts of WC-3908, the producer of cyclothiazomycin C. Peaks labeled with an asterisk do not correspond to DTT-labeled cyclothiazomycin C. (b) Conserved open-reading frames from each of the three cyclothiazomycin gene clusters (precise cluster boundaries are not yet established). Genes are color-coded with proposed functions given in the legend. The strain used for the comparison of cyclothiazomycin A is Streptomyces hygroscopicus subsp. jinggangensis 5008, and cyclothiazomycin B is Streptomyces mobaraensis. (c) Precursor peptide sequences of cyclothiazomycins A, B, and C. Highlighted in red are residues that differ in the core region of the peptide. The asterisk denotes the leader peptide cleavage site. (d) Structures of cyclothiazomycins A, B, and C.

