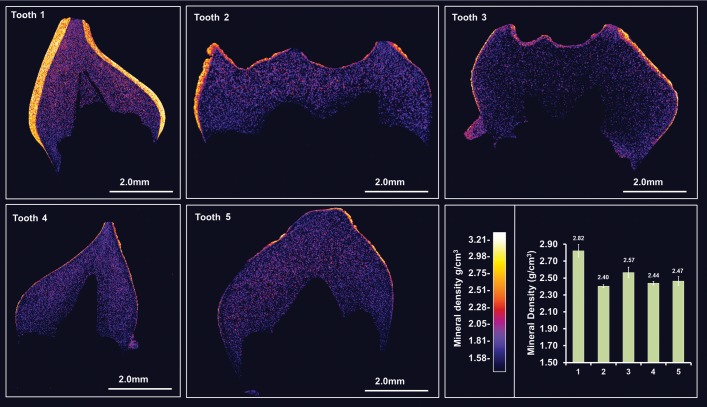
Figure 3.
High resolution X-ray CT analysis of exfoliated teeth 1–5. Typical CT sections through the teeth are presented using false colour calibrated with respect to mineral density to generate mineral density maps. Mean enamel mineral density for each tooth is also shown graphically. Tooth 1 exhibits an enamel layer apparently normal in structure and density. Teeth 2 and 3 exhibit an obvious enamel covering though it is thinner in many areas, chipped, absent in places and is significantly reduced in mineral density compared with tooth 1 (P < 0.0001). Teeth 4 and 5 exhibit an even thinner covering of enamel with enamel absent in some areas. Again enamel mineral density is significantly lower than in tooth 1 (P < 0.0001). The only non-significant differences in enamel mineral density occur between teeth 4 and 5. Videos of 3D rendered CT data showing surface detail and internal structure of all teeth are available as Supplementary Material.

