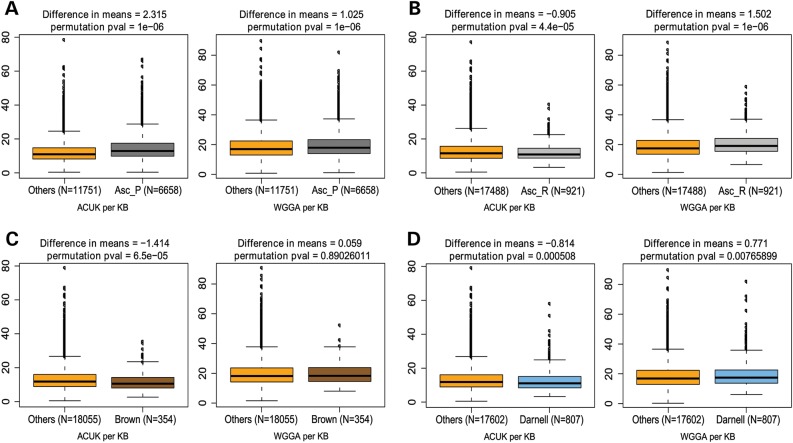
Figure 3.
Frequency of ACUK and WGGA in FMRP target datasets. Sequence motif frequency evaluation of the Ascano PAR-CLIP data (A), Ascano RIP-Chip data (B), Brown data (C) and Darnell data (D). The box plots show the median, quartiles, 1.5× interquartile range, and outliers in the number of ACUK (left) and WGGA (right) patterns per kilobase compared with the rest of the genes in the genome (Others). The difference in mean number of patterns per kilobase between the two groupings and the permutation P-value are given at the top of each graph; the number of genes in each grouping is given below each graph; number of permutations = 1 000 000.

