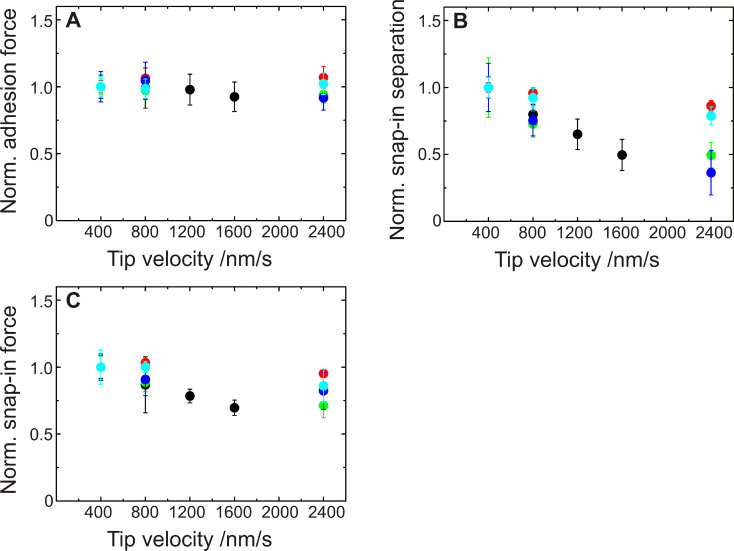
Figure 5.
Influence of the tip velocity on the adhesion of S. carnosus shown for five different cells. For each bacterium, values for adhesion force (A), snap-in separation (B) and snap-in force (C) are shown. The values are normalized to the value of the measurement with the lowest tip velocity (400 nm/s). Different colors represent different bacterial probes.

