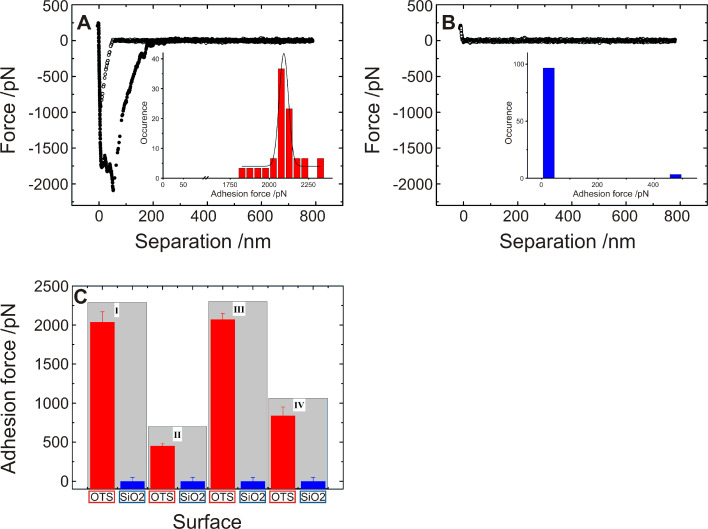
Figure 7.
Exemplary force/distance curve taken with a single S. carnosus probe on (A) a hydrophobic OTS-covered Si wafer and on (B) a hydrophilic Si wafer. The insets summarize the results of the adhesion force of 30 force/distance curves. (C): Mean adhesion force and standard deviation showing the result of at least 60 force/distance curves of four S. carnosus (I–IV) measured on hydrophobic OTS-covered and on hydrophilic Si wafers, covered by a natural SiO2. Each of the four bars represents measurements of the exact same bacterial probe.

