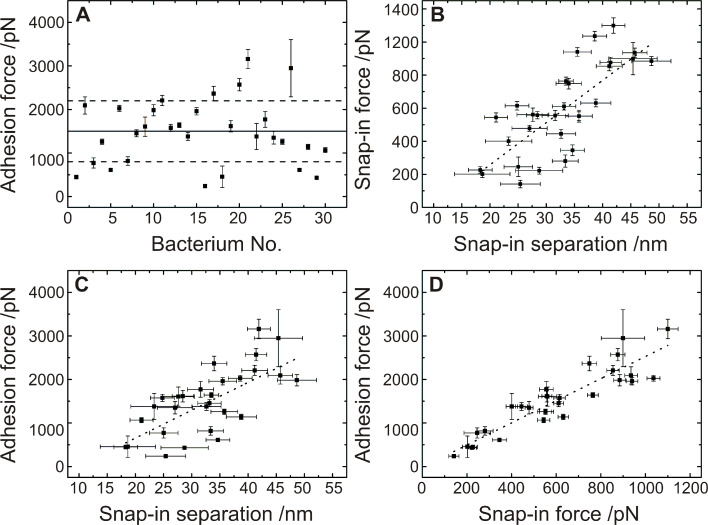
Figure 8.
Results of 30 different single cell force spectroscopy experiments on OTS with S. carnosus bacterial probes, each data point consists of 30 force/distance curves with a force trigger of 150 pN and a tip velocity of 800 nm/s. A: Solid line: average adhesion force, dashed lines: range of the standard deviation. B–D: Dotted lines: linear fit to the data.

