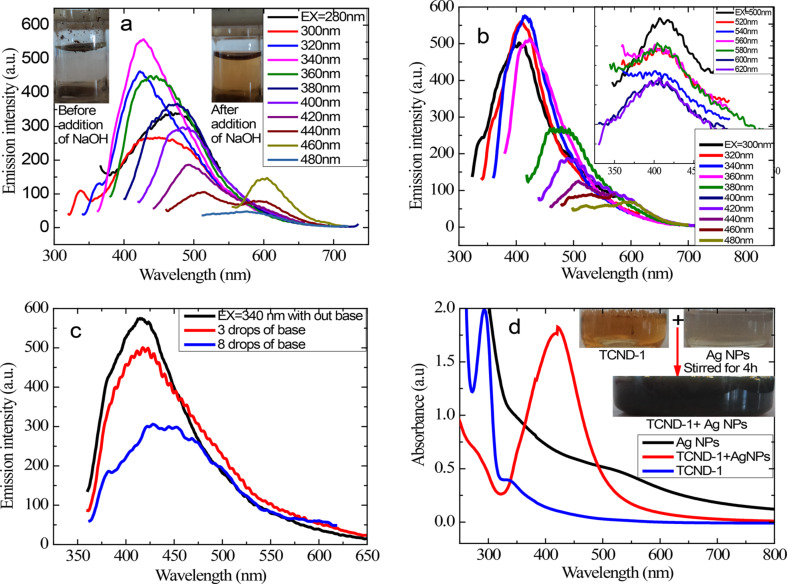
Figure 8.
PL emission spectra of TCND-1 at different excitation wavelength (a) in aqueous solution under basic conditions (b) in ethanol solution and upconversion emission spectra shown in inset. (c) Emission spectra of TCND-1 at an excitation wavelength of 340 nm before and after addition of three and eight drops of base in ethanol. (d) Absorption spectra of Ag NPs, TCND-1, and the composite material in aqueous solution under basic conditions, respectively.

