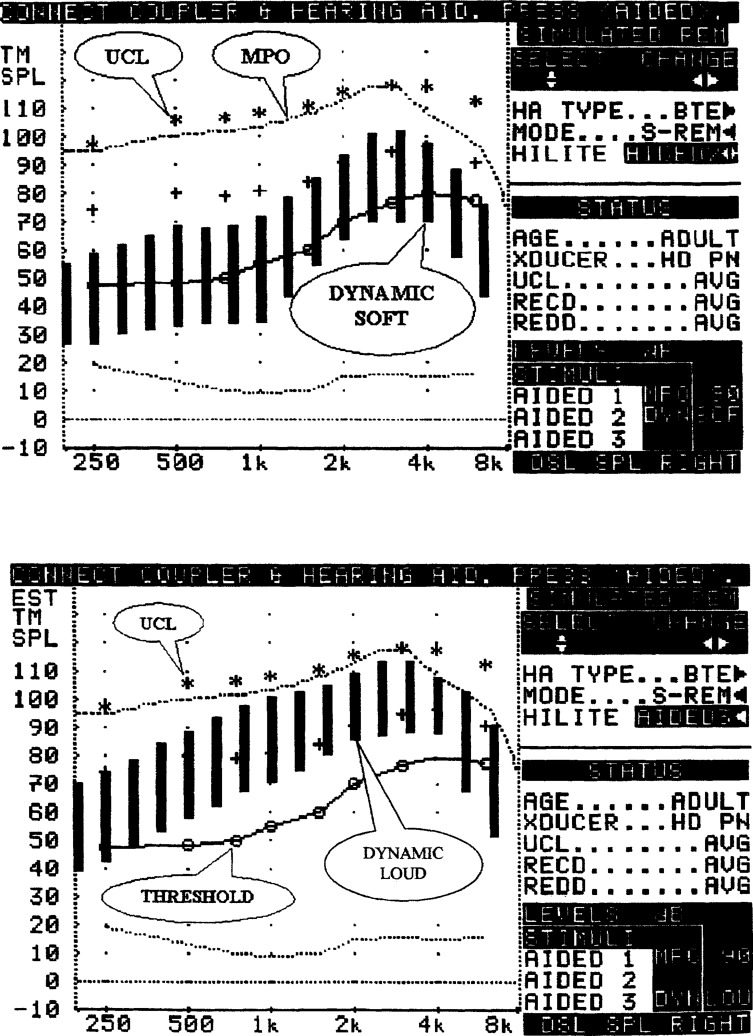
Figure 9.
Top panel: Illustration of the patient's hearing thresholds, uncomfortable loudness levels, the hearing aid's maximum power output, and the range of output for a dynamic soft signal (represented by vertical black bars). Bottom panel: Same as top panel, except illustrating range of output for a dynamic loud signal.(Courtesy of Audioscan).

