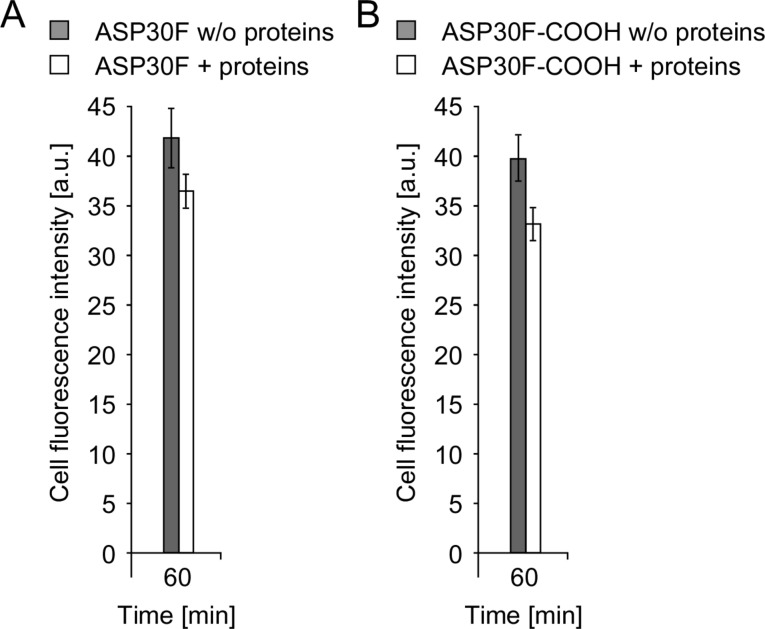
Figure 7.
Uptake of fluorescently labeled ASPs. (A/B) Automated microscopy to quantify time-dependent cellular uptake of fluorescent amorphous silica nanoparticles (ASP30F (A) and ASP30F-COOH (B)). CaCo-2 cells were exposed to the nanoparticles (100 µg/mL) suspended in DMEM (filled rectangles) or DMEM containing 10% human plasma (open rectangles) for 60 min. Total cellular fluorescence is displayed as arbitrary units (AU). Assays were performed in triplicates. Columns, mean; bars, ± SD from three independent experiments.

