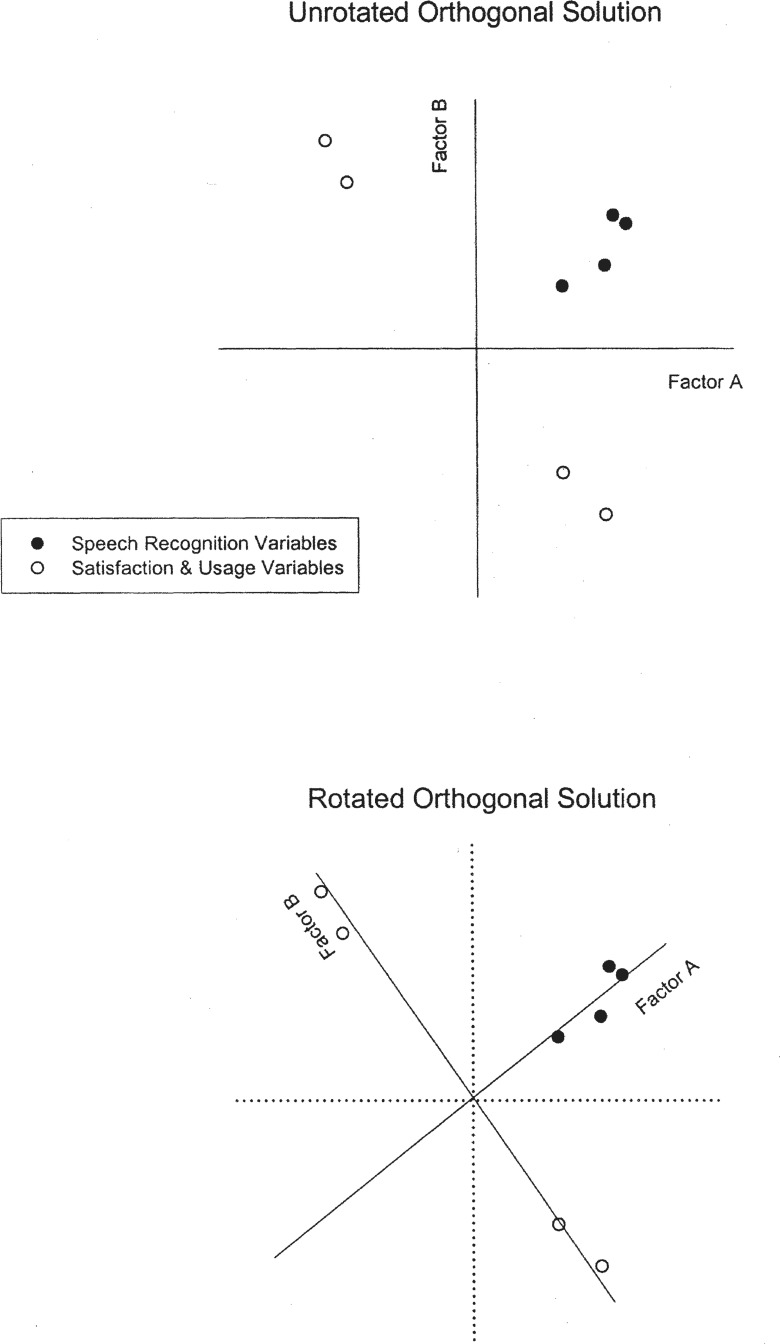
Figure 4.
Illustration of the concept of orthogonal rotation of factors for a hypothetical two-factor solution. Two sets of factor weights are shown, one for a set of speech recognition measures (filled circles) and one for a set of hearing aid satisfaction and usage measures (unfilled circles). The unrotated factor solution is shown in the top portion and the orthogonally rotated solution in the bottom portion of the figure. Note that the Factor A and Factor B axes are perpendicular (orthogonal) in both cases, but the axes have been rotated about 30 degrees counterclockwise in the bottom panel. Although the scatter of the data points in this two-dimensional plot remains the same in both illustrations (ie, the variance accounted for by the two-factor solution is the same), the interpretation of Factor A as a speech recognition factor and Factor B as a satisfaction and usage factor is much clearer for the rotated solution at the bottom.

