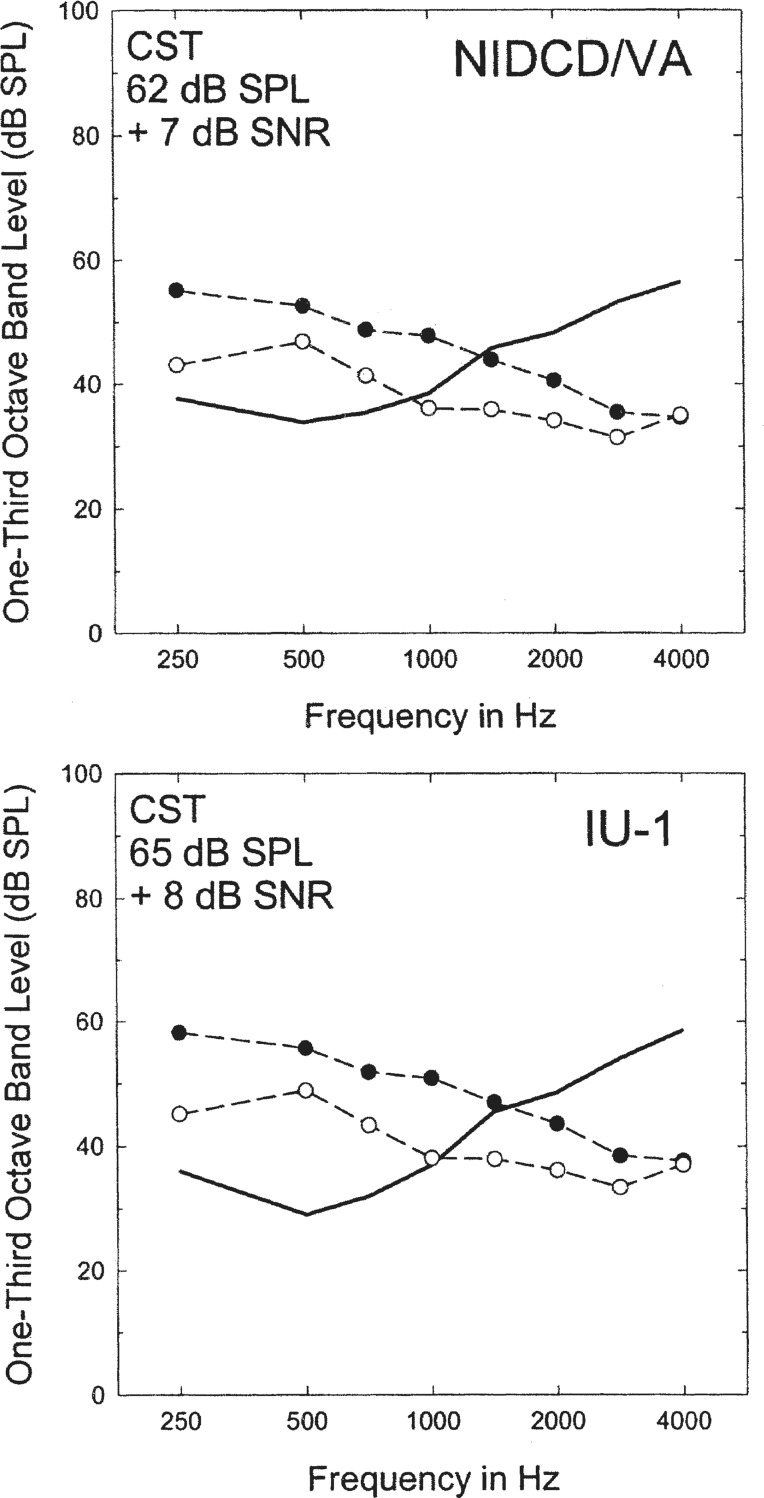
Figure 6.
Illustration of the similarity of the acoustical test conditions for one measure of speech recognition obtained in both the Indiana University-1 (IU-1) and the National Institute of Deafness and other Communication Disorders/Veterans Administration (NIDCD/VA) studies. In this case, unaided listening is illustrated for the Corrected Speech Test (CST) in a background of babble. For the NIDCD/VA study, the conditions were determined behaviorally using a criterion of 50% correct. The top panel illustrates the resulting audibility of the speech (filled circles) relative to the babble (unfilled circles) and mean better-ear hearing thresholds (heavy solid line). The babble is illustrated at the mean value of +7 dB reported by Larson et al. (2000). The lower panel illustrates the audibility of the speech signal for the comparison condition from the IU-1 study which fixed the speech and babble levels for all subjects. Clearly, the underlying acoustics of the listening conditions are very similar across studies, at least for the average listening conditions.

