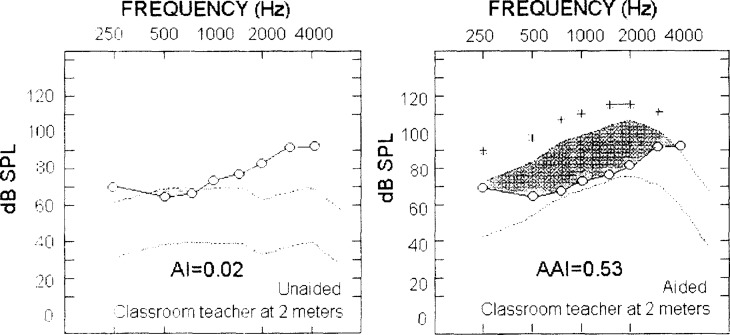
Figure 17.
An example of the Situational Hearing Aid Response Profile (SHARP) screen. In each panel, the listener's audiogram is shown in the open circles. The range of speech levels for a particular situation–in this case, a teacher's voice at 2 meters–is shown by the dotted lines. The shaded area shows the portion of the speech spectrum that is above threshold.

