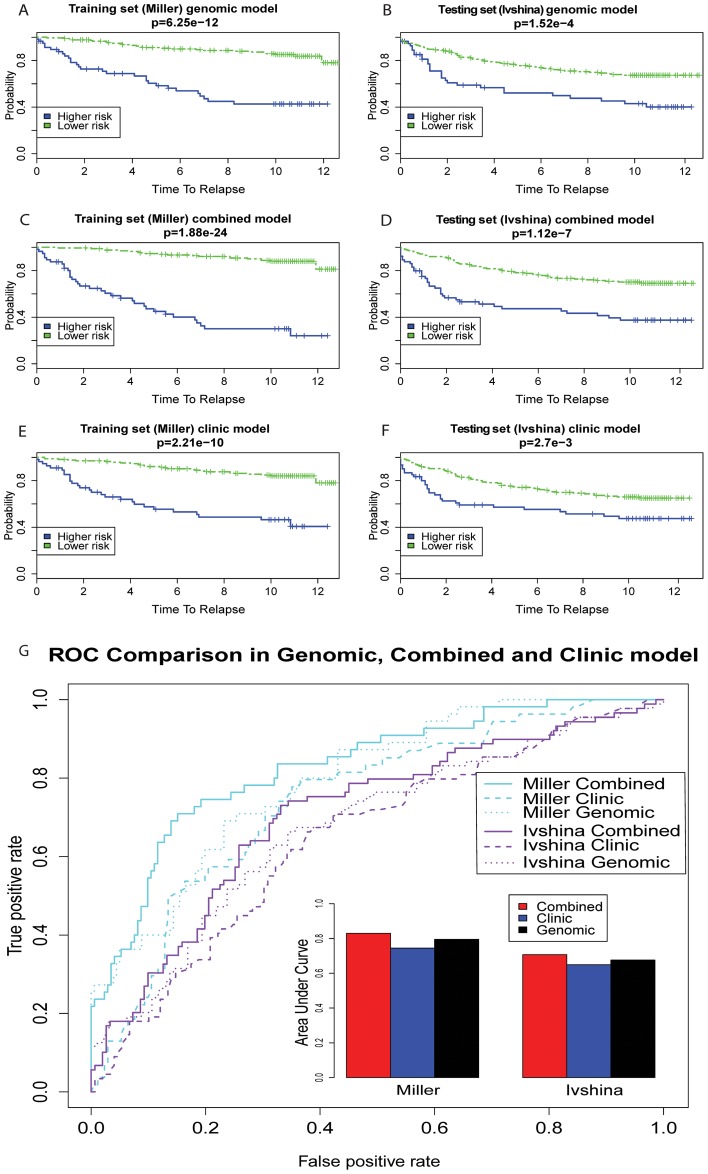
Figure 6. Comparing the prognosis performance from the pathway-based genomic model, the clinical model, and the combined model.
Higher risk and lower risk group are determined by the same PI cutoff as in Figure 4. The p-values in Kaplan-Meier curves are calculated using the Wilcoxon log-rank tests. In both the training data set and testing data set 2 (Ivshina data) that have full clinical information, the combined models outperform the pathway-based genomic model, and the pathway-based genomic model outperform the clinical model.

