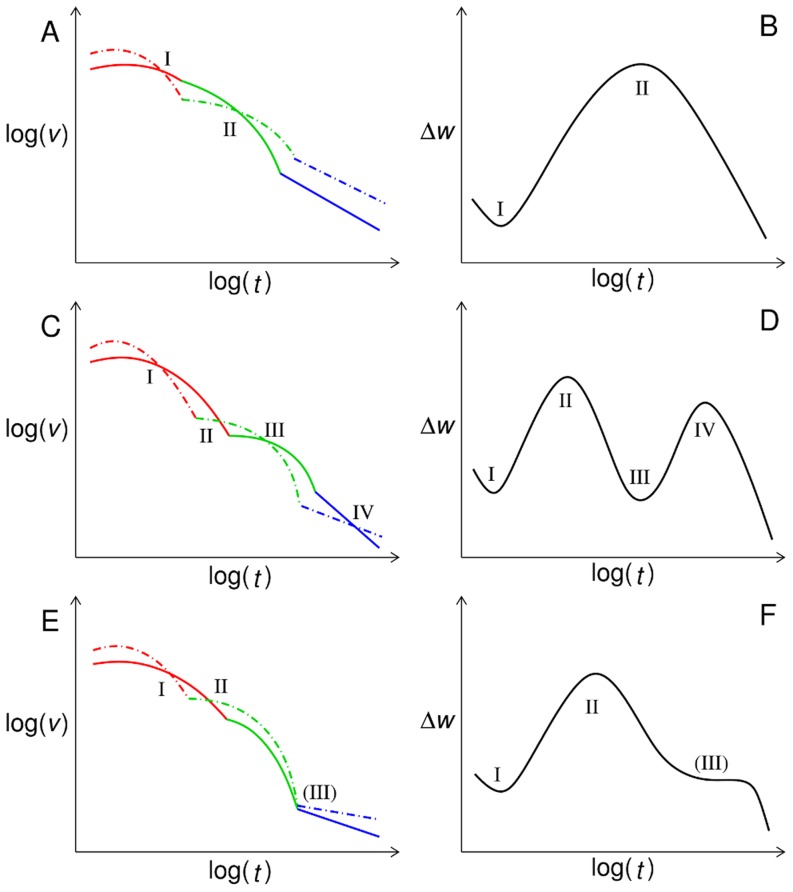
Figure 8. Summary of scenarios for a transient advantage of recombination.
The figure shows schematic plots of fitness velocities  (solid lines),
  (dashed lines) (A, C, E) and the corresponding behavior of
  (B, D, F). Red, green and blue line segments correspond to the initial, ASD and final regime, respectively. Latin numbers indicate intersections of the velocities and the corresponding extrema in
  . The last number in panels E and F is written in parenthesis to indicate that the two curves do not actually intersect but come very close to each other.

