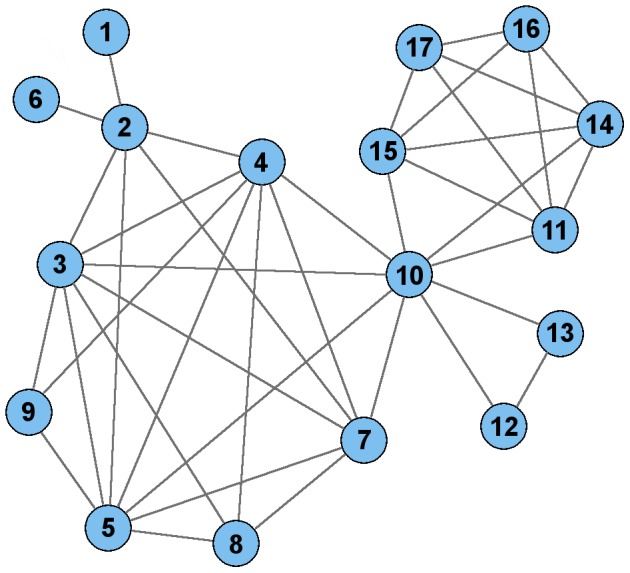
Figure 2. Plot of 17-node bloc, ps_1.

Each node represents a SNP allele and each edge represents a significant correlation between the SNP alleles representing its endpoints. The pattern corresponding to this bloc exhibited a risk association with psoriasis, with an odds ratio of 3.64 (CI: 2.75–4.80) and Bonferroni-corrected p-value of 5.01×10⁻¹⁶ in the discovery data and odds ratio of 3.86 (CI: 2.98–5.01) and Bonferroni-corrected p-value of 1.81×10⁻²⁵ in the validation data.
