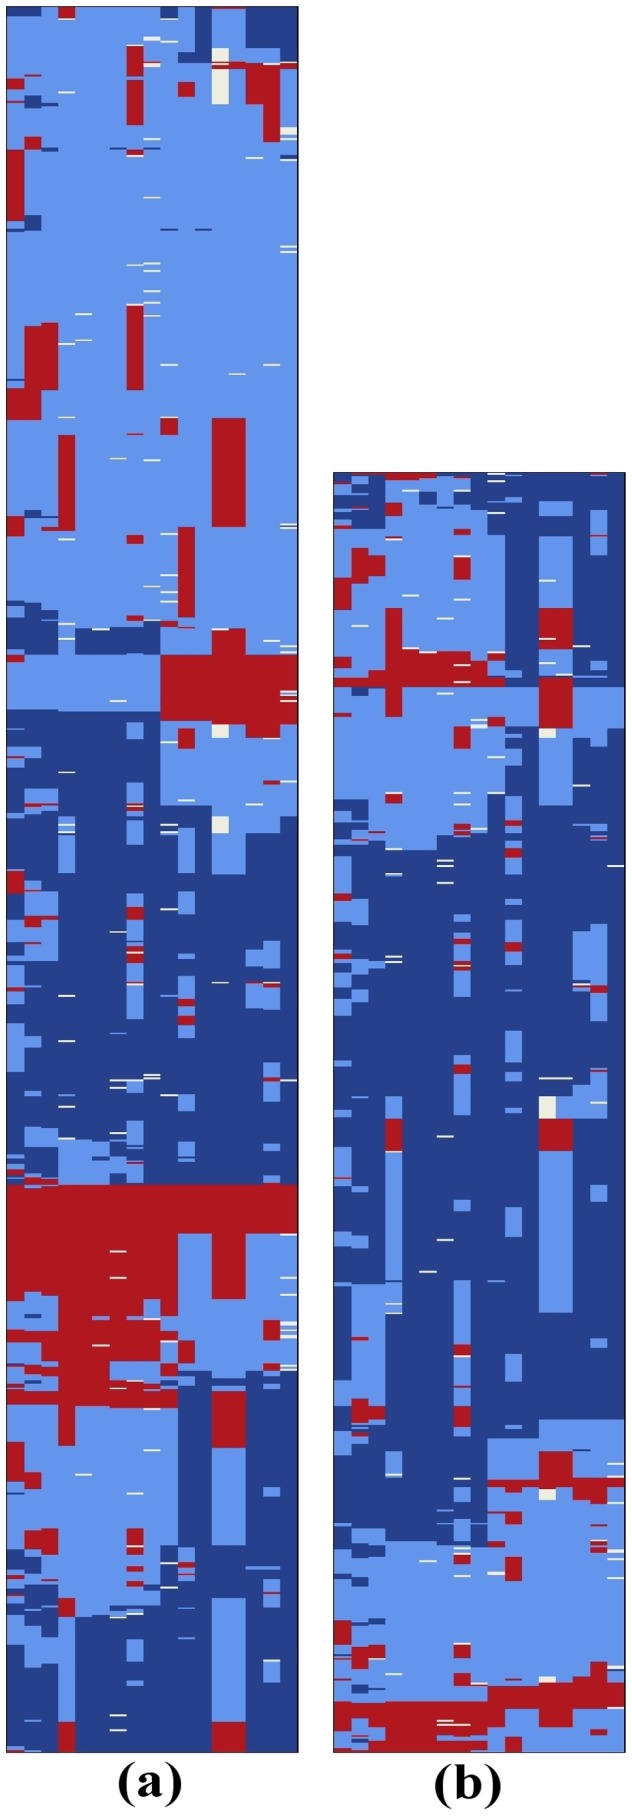
Figure 3. Genotype states of (a) 929 psoriatic cases and (b) 681 controls for bloc ps_1.

(Best viewed in color.) Each row represents an individual and each column represents a SNP. Dark blue represents a homozygote for the protective allele, light blue represents a heterozygote, red represents a homozygote for the risk allele, and white indicates missing data. Individuals (rows) were rearranged using TSP+k [77] in order to place similar individuals near each other and enhance visualization of patterns.
