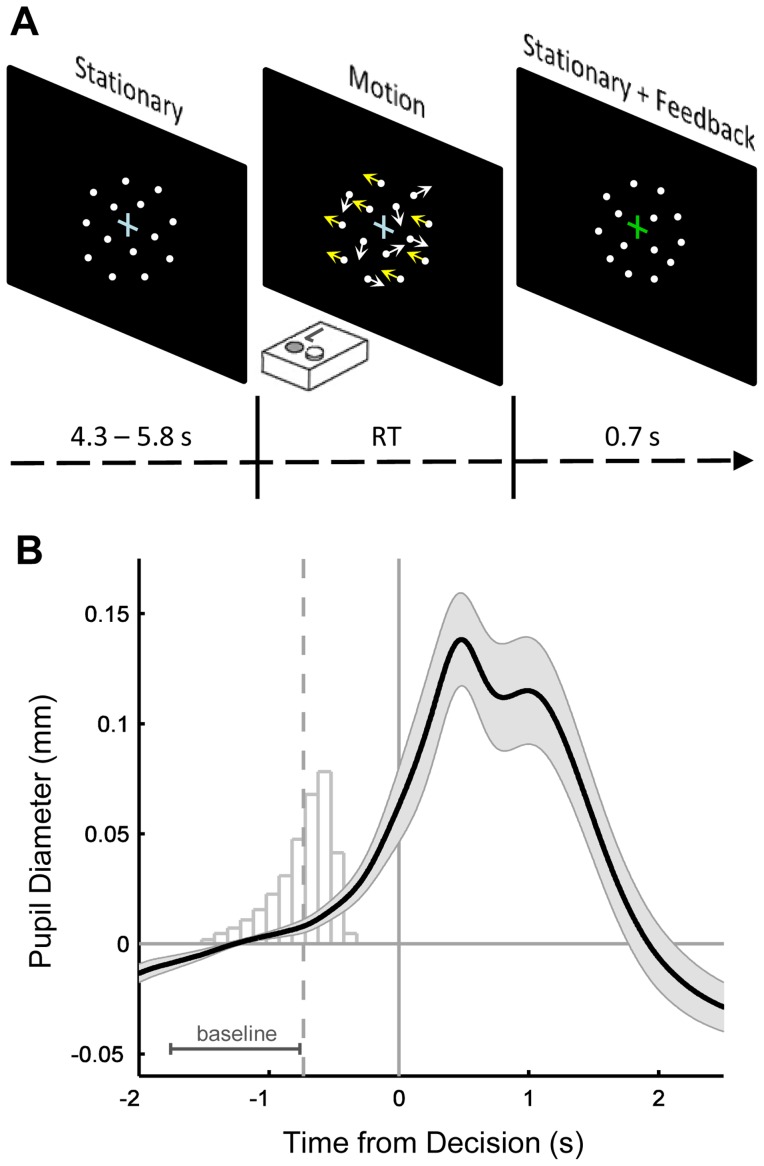
Figure 1. Random dot motion task.
A. Schematic of a single trial of the random dot motion task. ‘Left’ or ‘right’ decisions were made with spatially compatible button presses under a deadline of 1500 ms after motion onset. Motion ceased upon response and was followed by an isoluminant mask of stationary dots, and feedback was indicated by a change in fixation cross color. B. Grand-average evoked pupil responses locked to the time of the decision. Histogram indicates the distribution of motion onset times relative to the subsequent response, after pooling trials across all subjects. Time period marked ‘baseline’ indicates the window over which baseline pupil diameter was calculated, in this case for trials characterized by the grand-mean response time (dashed vertical line). The minimum response-to-stimulus interval was 5 seconds; hence the prominent decision-related pupil dilation had sufficient time to return to baseline levels before the measurement period for baseline pupil diameter on the following trial. Shaded regions indicate S.E.M.

