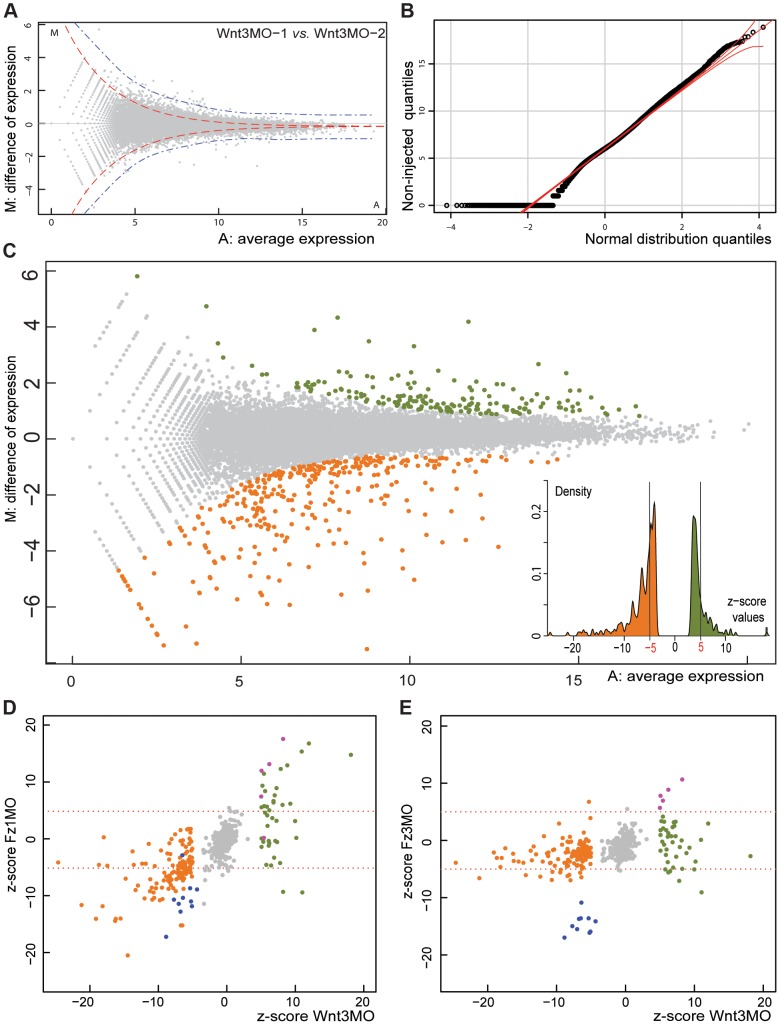
Figure 1. Identifying Clytia early gastrula patterning genes by DGE.
A) Visualization of variation between two independent Wnt3-MO early gastrula replicate samples (“MA plot”). For each reference transcript (grey dots), M is the difference of read density between the two samples and A its average expression level in the combined samples (see Methods). Red and blue dotted lines give estimates of the distribution zone outside which values are statistically significant, based on the standard deviation (4xSD) of a theoretical distribution (red) calculated using the random sampling model, or real variation (blue) estimated by the comparison of technical replicates [50]. B) Demonstration of the near-normal distribution of the log2 counts of the mapped reads from one of the non-injected embryo samples by a QQ plot, a necessary condition to use the Random Sampling Model assumption in DGE analysis. C) MA plot of read data from Wnt3-MO versus non-injected embryo samples. Applying the 1% cut-off p-value for statistical significance corresponding to the threshold z-score of +/−3.3 identifies 148 transcript sequences as over-expressed (green dots) and 232 as under-expressed (orange dots) in Wnt3-MO embryos. The more stringent +/−5.0 threshold for z-score values eliminates a cluster of genes with expression characteristics very close to the overall population of non-differentially expressed genes, as demonstrated in the histogram (insert) and reduces the number of transcripts to 44 and 135 for Wnt3-MO embryo over- and under-expressed transcripts respectively. D, E) Z-scores for the Wnt3-MO embryo over- (green dots) and under- (orange dots) expressed transcripts plotted against those for two other morpholino-injected embryo groups harvested at the same developmental stage. Z-scores were calculated for experimental versus non-injected values in each case. D: Wnt3-MO versus Fz1-MO; E: Wnt3-MO versus Fz3 MO. Transcripts significantly under-expressed in all three MO groups (z-scores less than -5: probably from bacterial contaminants) are represented as blue dots and over-expressed (z-scores greater than 5; probably injection damage-related) as purple dots.

