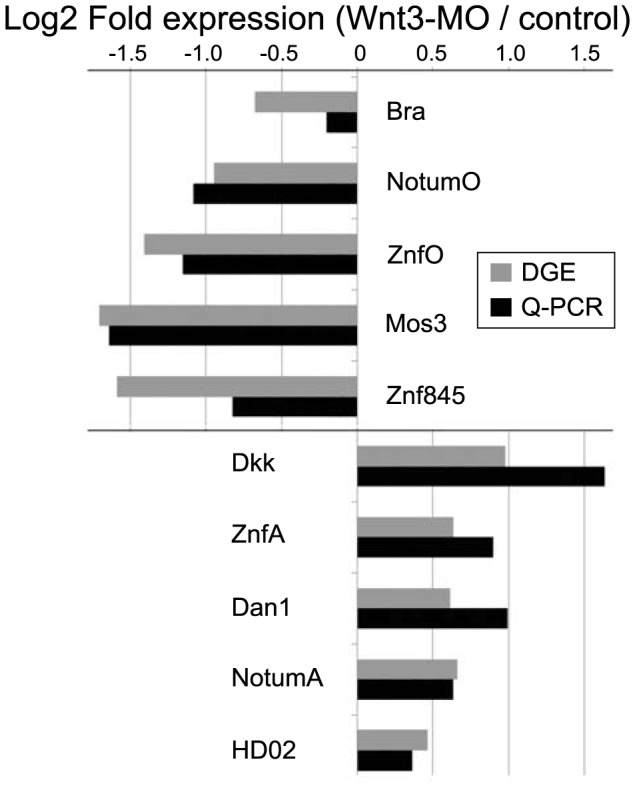
Figure 5. Equivalent differential expression responses determined by DGE and Q-PCR.

For ten selected transcripts from different DGE classes and with different expression profiles (see Table 1, Figure 4), transcript levels at the early gastrula stage were determined by Q-PCR in Wnt3-MO and non-injected early gastrula embryos. The ratio of expression levels of selected genes between injected and control embryos, normalized with respect to EF-1α is compared to the DGE data represented in the same way by using the counts of reads mapped rather than the number of cycles of Q-PCR amplification. Transcript identities are shown beside each pair of bars.
