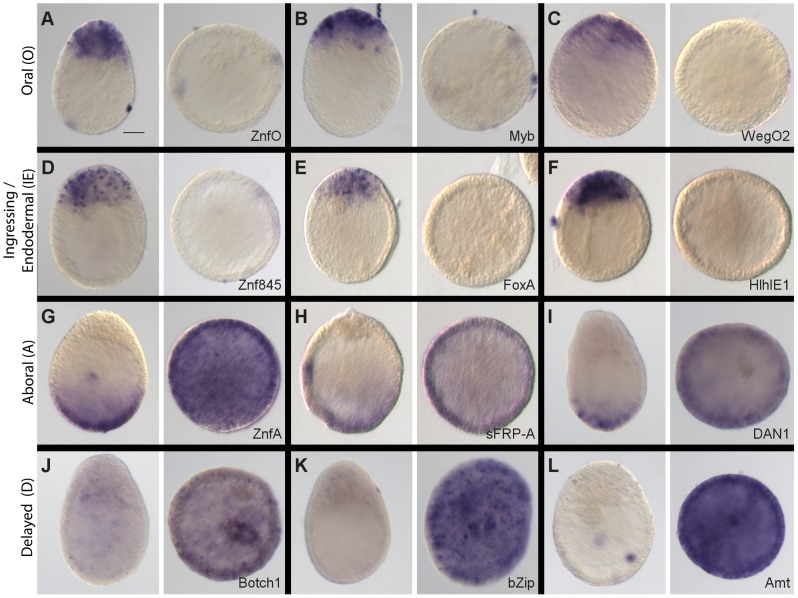
Figure 6. Stereotyped modification of gene expression patterns in Wnt3-MO embryos.
In situ hybridization analysis of selected transcripts in untreated (left panels) and Wnt3-MO injected (right panels) early gastrulae. Each expression pattern type is represented in the transcripts analyzed, as indicated on the left. A-C: O-type pattern transcripts; D-F: IE-type pattern transcripts, G-I: A-type pattern transcripts; J-L: D-type pattern transcript. For Botch1 (J) and bZip (K), individual cells with high expression on the blastocoelar face of the ectoderm were discernible in the Wnt3-MO embryos. Representative images of the patterns observed in at least three experiments are shown. All control embryos are oriented with the oral pole uppermost. Gene identity is shown in the bottom right of each pair of panels. Scale bar 50 µm.

