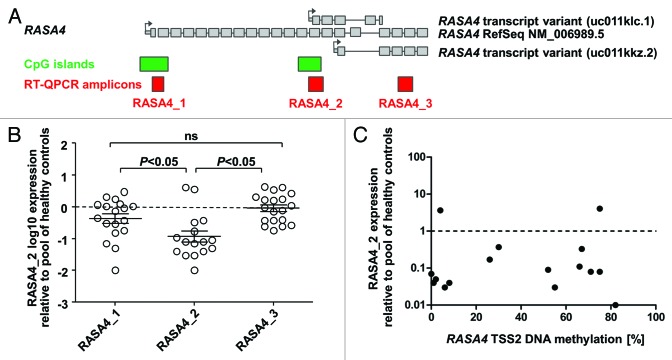
Figure 2. The second RASA4 transcript is repressed in JMML. (A) Structure of the RASA4 genetic locus and composition of transcript variants. Large gray boxes represent coding exons; small gray boxes, 5′ untranslated region; arrows, transcription start sites; green boxes, CpG islands; red boxes, amplicons used for RT-QPCR. (B) Expression level of three RASA4 transcripts in JMML mononuclear cells. Expression for each transcript was measured by three RT-QPCRs normalizing to HPRT, ACTB and GAPDH, respectively, and results were averaged. Expression in pooled blood cell RNA from 5 healthy individuals was used as calibrator and set to 1.0. P values were computed using analysis-of-variance across the groups (transcripts) and Tukey’s multiple comparison test for pairwise comparisons. (C) Expression levels of the RASA4 variant 2 transcript in mononuclear cells from 15 JMML patients in relation to CpG island methylation. Abbreviations: CpG, cytosine-phospho-guanine; RT-QPCR, reverse-transcriptase quantitative polymerase chain reaction.

An official website of the United States government
Here's how you know
Official websites use .gov
A
.gov website belongs to an official
government organization in the United States.
Secure .gov websites use HTTPS
A lock (
) or https:// means you've safely
connected to the .gov website. Share sensitive
information only on official, secure websites.
