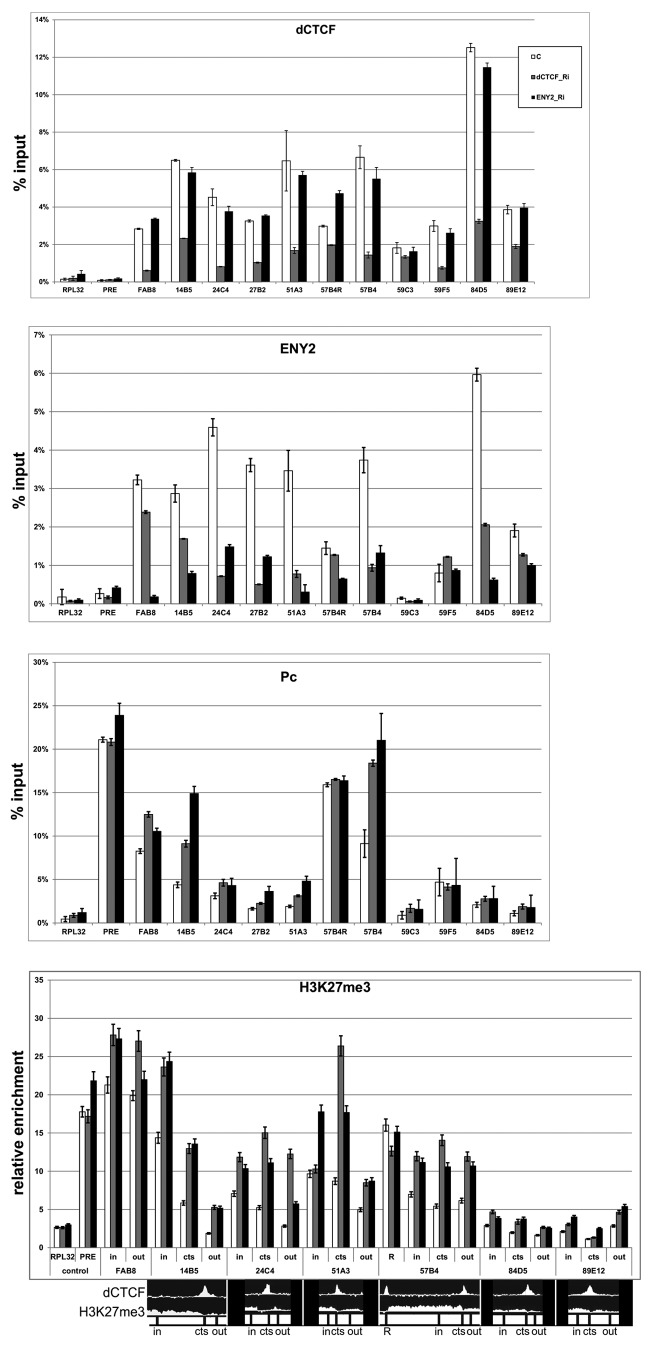
Figure 3. dCTCF and ENY2 determine some boundaries of H3K27me3 domains in BG3 cells. Histograms show the results of ChIP for the relative amounts of dCTCF or ENY2 or Pc or H3K27me3 in previously defined dCTCF binding regions on chromatin isolated from BG3 cells treated with specific dsRNA from dCTCF (dCTCF_Ri) or e(y)2 (ENY2_Ri) coding regions and incubated with corresponding antibodies. “C” is a mock RNAi control obtained with BG3 cells treated with GFP dsRNA. The bxd region (PRE) of bithorax complex25 was used as dCTCF/ENY2-independent region of Pc binding. Error bars show standard deviations of triplicate PCR measurements. The results are presented as a percentage of input DNA. The results for ChIP with histone modifications are presented as a percentage of input DNA normalized relative to the amount of the H3 histone at the tested regions. To test for relative amount of H3K27me3, we used the pairs of primers inside (in), at the boundary (cts), and outside (out) of the H3K27me3 domains. The distribution of dCTCF and H3K27me3 is shown at the bottom. Relative locations of primers (in, cts, out) for ChIP on the cytological map are indicated in Figure S3.

An official website of the United States government
Here's how you know
Official websites use .gov
A
.gov website belongs to an official
government organization in the United States.
Secure .gov websites use HTTPS
A lock (
) or https:// means you've safely
connected to the .gov website. Share sensitive
information only on official, secure websites.
