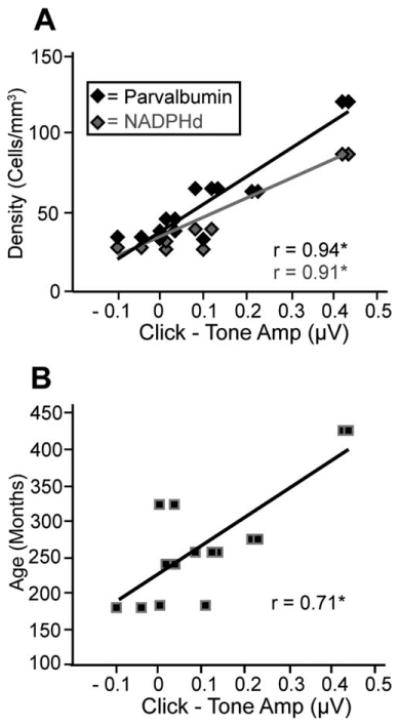
Figure 11.

Amplitude differences as a function of cell density and age. The difference between threshold amplitudes of clicks and high-frequency tone auditory brainstem responses as a function of cell density (A) and age (B). Higher values indicate greater prominence of click amplitudes over tones amplitudes at threshold. Again, this suggests that clicks and tones are processed differently and that the magnitude of this difference correlates with both cell density and age. Note that the x-axis is identical in both panels for direct comparison.
