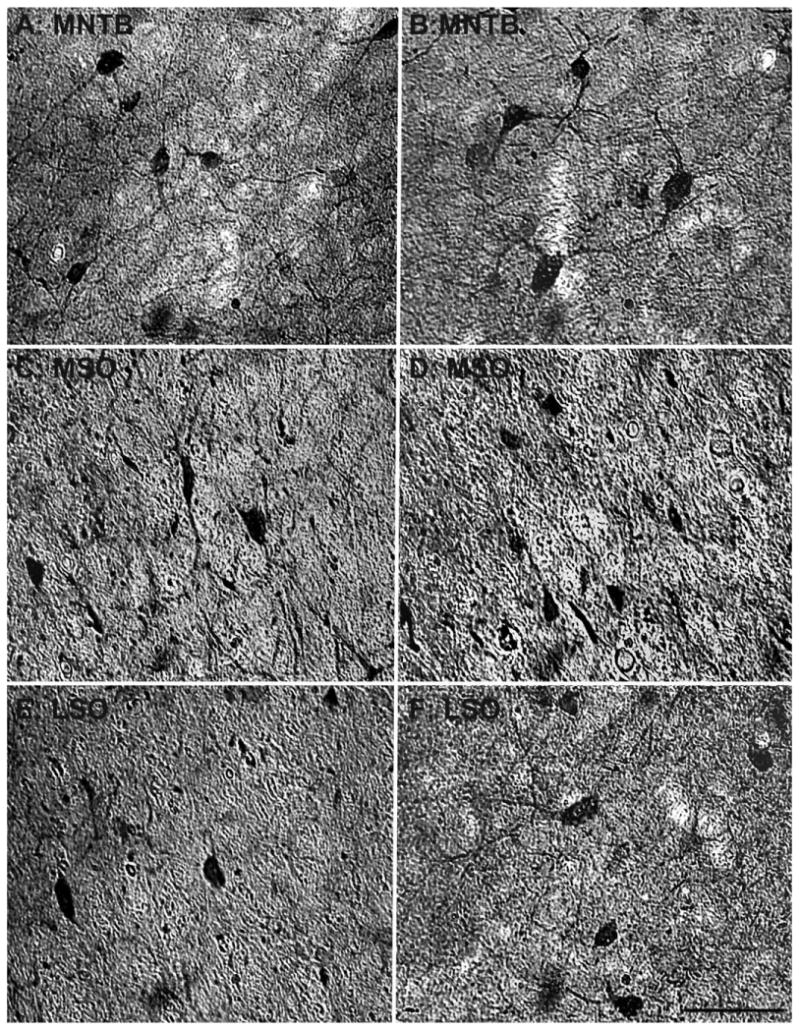
Figure 3.

Comparison of parvalbumin-positive cell density of the SOC between a 15- and a 35-year-old animal. Comparison of micrographs from a 15-year-old MNTB (A) and a 35-year-old MNTB (B) reveals no apparent age-related changes in density. However, when comparing a 15-year-old MSO (C) with a 35-year-old MSO (D), age-related density changes become apparent. Similar to the MNTB, the LSO showed no clear age-related changes between the 15-year-old (E) and the 35-year-old (F) animals. Conventions as in Figure 2. Scale bar = 100 μm.
