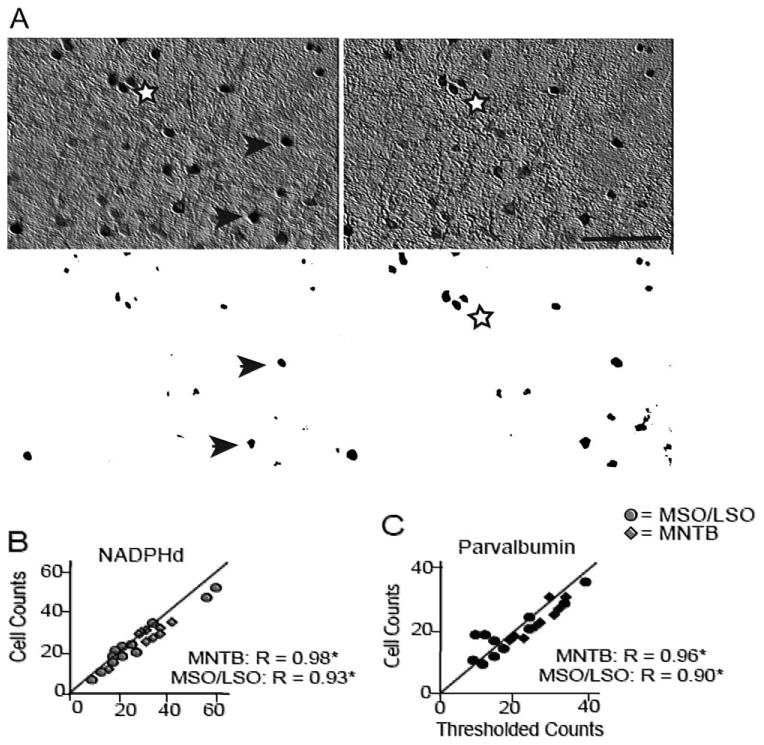
Figure 4.

Examples of the threshold analysis on histological sections to assess the observer's ability to differentiate positively labeled cells from background staining. A: Example of an analyzed section and its corresponding thresholded and binarized image at two different planes of the optical disector. In the left panel, arrows mark positively stained neurons counted at that plane, and the stars demarcate neurons that were counted when the optical plane moved (right panel). This sample is from the LSO, which along with the MSO showed strong background staining compared with the MNTB. Comparing NADPHd (B)- and parvalbumin (C)-positive cell counts and the counts from their thresholded pictures in the MNTB (lozenges) and the MSO/LSO (circles) revealed strong correlations, suggesting that the observers reliably differentiated labeled cells from the background. The MNTB served as a control in these comparisons because of its noticeably reduced background staining. Scale bar = 250 μm.
