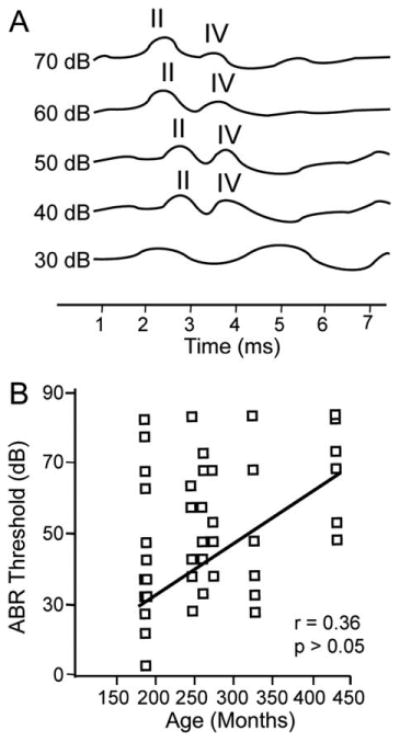
Figure 6.

Schematic auditory brainstem responses (ABRs). A: Reconstructed ABR from the left ear of a 15-year-old macaque with peaks II and IV labeled when present. B: ABR thresholds from the seven monkeys in which ABRs were collected for all stimuli (clicks and low-, middle-, and high-frequency tones). Threshold was defined as the last stimulus intensity in which wave II and wave IV were observable.
