
Figure 9.
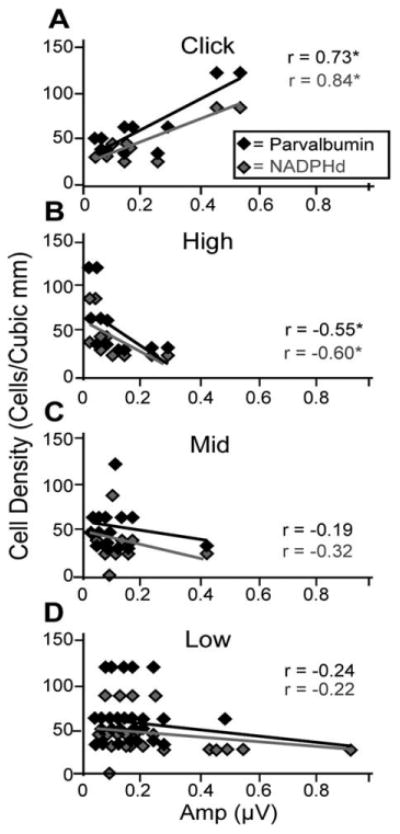
Correlations between cell densities and threshold ABR amplitudes differ by stimulus type. The cell density of NADPHd-positive (gray) and parvalbumin (PV)-positive (black) cells combined from the principle nuclei of the superior olivary complex (SOC) as a function of peak IV amplitudes using click stimuli (A) or B) or high-frequency (B), middle-frequency (C), and low-frequency (D) tone stimuli. All stimuli were presented at threshold intensities. Note the inverse relationship between tones and cell density and the opposite trend with click stimuli. This observation suggests that tones and clicks are processed differently and that these differences correlate with chemical changes in the SOC.