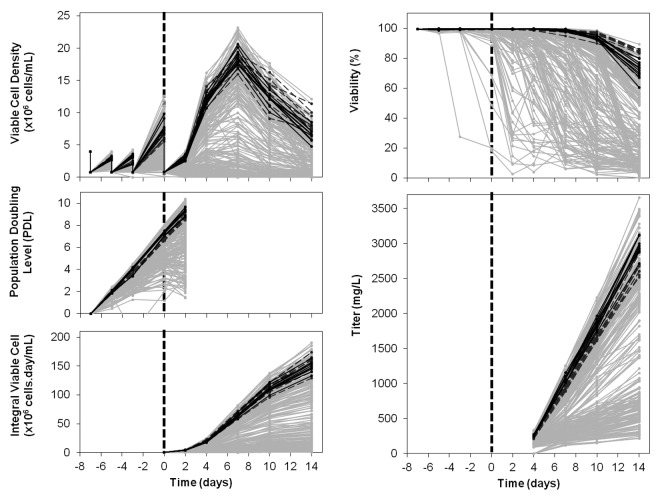
Figure 3. Viable cell density, viability, IVC, PDL and titer. Data from day -7 to day 14 (viable cell density and viability), from day -7 to day 2 (PDL) and from day 0 to day 14 (IVC and titer) for 376 media blends and 20 controls. Dashed black lines: Ctrl 1; full black lines: Ctrl 2; gray lines: all other tested conditions.

An official website of the United States government
Here's how you know
Official websites use .gov
A
.gov website belongs to an official
government organization in the United States.
Secure .gov websites use HTTPS
A lock (
) or https:// means you've safely
connected to the .gov website. Share sensitive
information only on official, secure websites.
