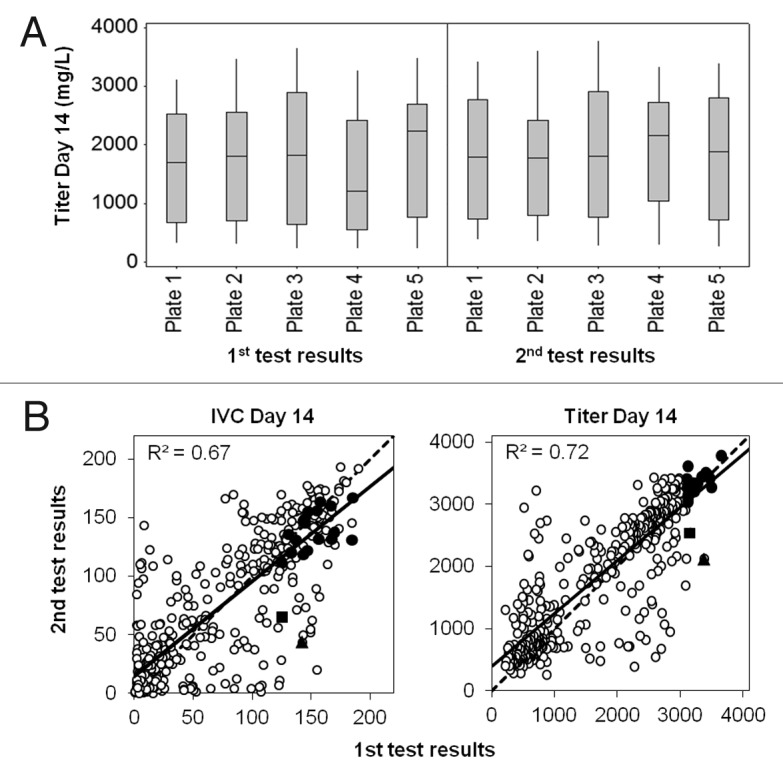
Figure 7.Robustness of the blending experiment method. A. Box-plots showing titer distribution on day 14 for the 5 plates of the first and the 2nd blending experiment. B. Correlation between the first and the second media blending experiment regarding IVC (x 106 cells.day/mL) and titer (mg/L) obtained on day 14. Open circles represent the 376 tested conditions and black symbols represent the 20 best conditions for titer in the first experiment (circles represent the 18 conditions that were highly reproducible whereas the square and the triangle represent the two conditions lacking reproducibility).
