
Figure 1. Pho23 Represses the Transcription of Several ATG Genes When Autophagy Is Suppressed.
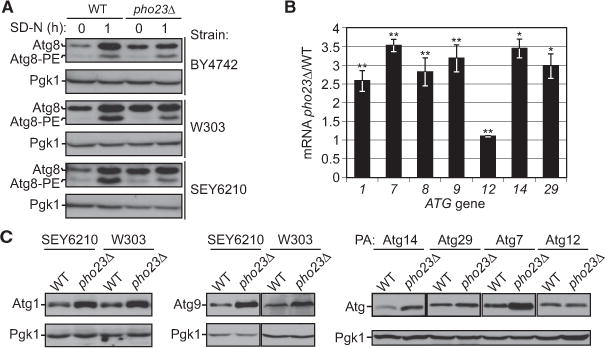
(A) Protein extracts were generated from wild-type and pho23Δ strains in the indicated backgrounds after growth in YPD to mid-log phase (growing conditions) and then shifted to SD-N medium (nitrogen starvation). Proteins were resolved by SDS-PAGE, then detected by western blot with anti-Atg8 and anti-Pgk1 (loading control) antisera. The Atg8 protein level was increased in growing conditions in pho23Δ cells relative to the wildtype in all three strain backgrounds.
(B) The ratio of pho23Δ to wild-type mRNA levels of the indicated ATG genes was measured by qRT-PCR. RNA extracts were prepared from wild-type (SEY6210) and pho23Δ (JMY047) cells after growth in YPD to mid-log phase. The error bars represent the SEM of at least three independent experiments. Two-tailed t test was used for statistical significance; *p < 0.05, **p < 0.01.
(C) Protein extracts were prepared as in (A) from wild-type and pho23Δ strains in growing conditions. The indicated proteins were detected by western blot using antisera to the endogenous proteins or an antibody that detects the protein A (PA) tag. Pgk1 was used as a loading control.